
NEW: Send your data direct to Plot.ly — import.io blog. Plot.ly is a young graphing and analytics startup, which makes it easy to analyze and visualize data.
Using Plot.ly, users can import data from anywhere, then make and share online graphs using Python, MATLAB, R, Excel, Julia and their web app. Users can also share work and collaborate on projects. Plot.ly forms an important step in building the infrastructure for data science to be further democratized. Their goal is to be an awesome platform for collaboratively analyzing data and making graphs. “We love to connect with folks using data in any way, whether it's for streaming data, running stats and fits on data, or making beautiful graphs.” - Matt Sundquist, Co-Founder & COO of Plot.ly Why did we choose Plot.ly for our first integration? How to create data visualizations with D3.
D3 is a toolkit for building data visualizations from scratch.
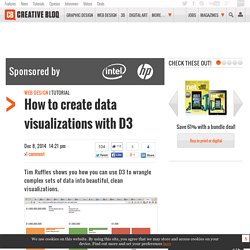
It's a thin wrapper around the DOM, so with HTML, CSS and JavaScript you're already halfway there. It's tremendously powerful, and more than anything it's tremendous fun. Never again will you disappoint your designer by stuffing their expertly tuned Dribbble-fodder into a boring chart. Subscription offer D3 is best taught by example, so we'll recreate xkcd's 'Money' visualization. All the files you need for this tutorial can be downloaded from here. Giving ugly code a makeover Our task is split between data and presentation. We'll wrap up the data part in what D3 calls a 'layout'. Implementation Let's implement! As layouts are just JavaScript functions, and functions are objects, we expose our configuration function as the layout's group property.
Visualising At this point we've not actually displayed anything on screen. Finally we need to consider our units. It's easier to define all static styling via CSS. Words: Tim Ruffles. Scatter Plot Matrices in R. One of our graduate student ask me on how he can check for correlated variables on his dataset.

Using R, his problem can be done is three (3) ways. First, he can use the cor function of the stat package to calculate correlation coefficient between variables. Second, he can use functions such as pairs(graphics)to visually check possible correlated variables. Third, he can combine the first two approach following the example of vinux in stackoverflow or using ggpairs function of GGally package. First Approach. Documentation, Unity scripting languages and you. Everybody has their favorite scripting language, and the use of different languages evolves over time.
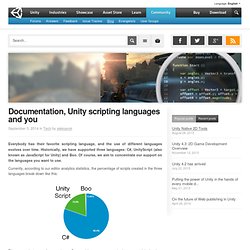
Historically, we have supported three languages: C#, UnityScript (also known as JavaScript for Unity) and Boo. Of course, we aim to concentrate our support on the languages you want to use. Currently, according to our editor analytics statistics, the percentage of scripts created in the three languages break down like this: This means that, as so few people use Boo, and the resources required to support it in the docs are not negligible, we’ve decided to drop support for Boo documentation for the Unity 5.0 release and use our resources in a more constructive way. When Unity 5.0 launches, we will also drop “Create Boo Script” from the menu.
We have listened to your feedback, and what you’ve been telling us that you really want from your documentation is C# examples across the board. Love Generating SVG With JavaScript? Move It To The Server! Advertisement I hope that by now, in 2014, there is no need to explain why SVG is a blessing to developers who want to ensure that their graphics look sharp on all devices, especially with their huge diversity of resolutions.

But just like any other technology, SVG has its limitations. And in this article, we’ll talk about how to bypass some of them. What’s The Problem? Why would you even need to generate SVG on the server? Before answering these questions, let’s look at the state of the industry. And there are a lot to choose from, from general-purpose ones such as Raphaël.js1, Snap.svg2 and svg.js3 to the myriad of smaller ones, as well as, if you do plotting and data visualization, gRaphaël4, Highcharts5 and D36. So the right question is, how do we continue generating SVG with JavaScript while also putting the results of the generation on the server? Solutions Simply Recreate All Logic on the Server This solution is possible, just not practical. Straightforward Solution PhantomJS.