
More US Women Are Moving Into Science, Tech, Engineering & Math Occupations — Beautiful News. Gender Pay Gap. Chart of the day: The most manly (and womanly) jobs in Australia. Updated 21 May 2018, 2:12amMon 21 May 2018, 2:12am While we've seen plenty of changes in the workforce in recent years, some jobs remain stubbornly 'men's work' and 'women's work'.
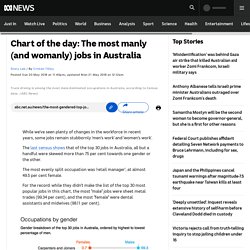
The last census shows that of the top 30 jobs in Australia, all but a handful were skewed more than 75 per cent towards one gender or the other. The most evenly split occupation was 'retail manager', at almost 49.5 per cent female. For the record: while they didn't make the list of the top 30 most popular jobs in this chart, the most "male" jobs were sheet metal trades (99.34 per cent), and the most "female" were dental assistants and midwives (98.11 per cent).
What should I read next? Where can I find more charts? This is part of a new daily series featuring charts that tell a story. Topics: work, women, men, feminism, australia First posted 21 May 2018, 1:40amMon 21 May 2018, 1:40am Updated 21 May 2018, 2:12amMon 21 May 2018, 2:12am What should I read next? Where can I find more charts? Global Gender Gap Report 2020.
Why gender parity matters Gender parity has a fundamental bearing on whether or not economies and societies thrive.
Developing and deploying one-half of the world’s available talent has a huge bearing on the growth, competitiveness and future-readiness of economies and businesses worldwide. The index’s rankings offer an effective means to benchmark progress. They are designed to create global awareness of the challenges that gender gaps pose, as well as the opportunities that emerge when action is taken to reduce them. Top 10 Political representation on the rise, but is it enough? Now in its 14th year, the Global Gender Gap Report 2020 benchmarks 153 countries on their progress towards gender parity in four dimensions: Economic Participation and Opportunity, Educational Attainment, Health and Survival and Political Empowerment.
The report presents a decidedly mixed picture. The “role model effect” reaps dividends at the top … … but not lower down Best in class Could do better. Women in the Workplace 2019. This year marks the fifth year of our research on women in the workplace, conducted in partnership with LeanIn.Org.

We look back on data and insights since 2015 from close to 600 companies that participated in the study, more than a quarter of a million people that were surveyed on their workplace experiences, and more than 100 in-depth one-on-one interviews that were conducted. (See our infographic below for top-level findings from the past five years.) We strive to provide individuals with disabilities equal access to our website. If you would like information about this content we will be happy to work with you. Please email us at: McKinsey_Website_Accessibility@mckinsey.com In the last five years, we’ve seen more women rise to the top levels of companies. Still, women continue to be underrepresented at every level. The culture of work is equally important. Done right, efforts to hire and promote more diverse candidates and create a strong culture reinforce each other. The Data on Women Leaders. Majorities of Americans see men and women as equally capable when it comes to some of the key qualities and behaviors that are essential for top leaders in politics and business.
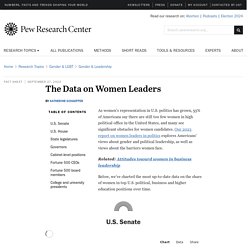
Yet women still make up a small share of top leadership jobs in both of these realms. Our 2018 report explores Americans’ views about women leaders, the barriers they face and prospects for the future. Below, we’ve charted the most up-to-date data on the share of women in top U.S. political and business roles over time. U.S. SenateU.S. U.S. Share this chart: Download as PNG Copy and paste the below iframe code into your own website to embed this chart.