

Knight Digital Media Center Freedive: Searchable databases from Google spreadsheets. Welcome to the freeDive wizard — your guide to making a searchable database If you're new to freeDive, check out our how-to video.
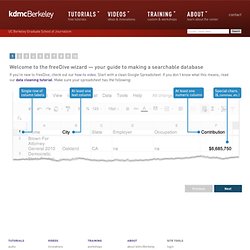
Start with a clean Google Spreadsheet. If you don’t know what this means, read our data cleaning tutorial. Make sure your spreadsheet has the following: Publish your spreadsheet This step gives freeDive access to your data by publishing your spreadsheet to the Web. Share your spreadsheet This step gives freeDive access to your spreadsheet URL. Enter your spreadsheet ID freeDive accesses your spreadsheet using the unique ID in the spreadsheet URL. Click to practice with a spreadsheet containing nearly 25,000 rows. Select the columns you want to include in your table At least one column must contain numeric data. You are working on spreadsheet: .
Coding for Journalists 101: Go from knowing nothing to scraping Web pages. In an hour. Hopefully. UPDATE (12/1/2011): Ever since writing this guide, I’ve wanted to put together a site that is focused both on teaching the basics of programming and showing examples of practical code.
I finally got around to making it: The Bastards Book of Ruby. I’ve since learned that trying to teach the fundamentals of programming in one blog post is completely dumb. Die Datenjournalismus-Leseliste. 8 useful Excel formulas for Computer Assisted Reporting « Online journalist project. Any journalist who wants to work with data must learn how to use spreadsheet applications like Excel or Google Docs.
Here it’s a list of 8 useful formulas for Computer Assisted Reporting: 1) =SUM(number 1, number2, numb…) The most simple Excel formula, but it is essential. How many stories are related with public spending or funding? Calculate the total sum of a column is one of the most common operations you will use in data journalism. +Info 2) =(number1-number2) Very useful to calculate the increase or decrease of two values. 3) =(New number-old number)/old number It’s related with the previous formula and we use it if we need to find the percentage of change between two different figures. 4) =AVERAGE(fist cell in a range:last cell in a range) This formula is quite obvious. +Info 5) =MEDIAN(first cell in a range:last cell in a range) It looks for the mid-point and many times is more useful than the average. Teaching Materials from NICAR 2012 « Michelle Minkoff. I had the sincere honor of presenting at NICAR 2012 in St.
Louis for the second year in a row. I provide the takeaway materials here, if you find them useful. Bring Your Mapping Dreams to Fruition — code for demos of Leaflet and Raphael, for making zoomable and non-zoomable maps. Tipsheet with links to projects we’ve done at the AP using these tools, documentation and helpful tools to use, and sample code for some more basic projects I demoed during the session. CAR Training 2012. Reporters' Lab // How a conference taught me I know nothing. The Chicago Tribune's Brian Boyer removes his costume panda head before demonstrating PANDA, an open-source database system developed by Investigative Reporters and Editors. | Photo by Tyler Dukes It was the lightning talks that set my head spinning.
I’m a bit new to the world of data journalism, and up until that point, my first time at the annual Computer-Assisted Reporting conference had stopped just short of overwhelming. But after a few mile-a-minute presentations in this particular session , I only had one clear thought: There’s so much to know, and not enough time to learn it. Datawrapper ist ein Projekt der ABZV.
Die Untoten von ZEIT ONLINE. Twitter: How to archive event hashtags and create an interactive visualization of the conversation. The use of Twitter to collecting tweets around an event hashtag allowing participants to share and contribute continues to grow and has even become part of mass media events, various TV shows now having and publicising their own tag.
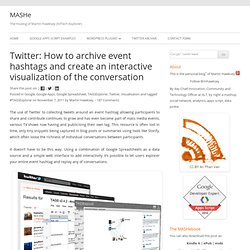
This resource is often lost in time, only tiny snippets being captured in blog posts or summaries using tools like Storify, which often loose the richness of individual conversations between participants. It doesn’t have to be this way. Using a combination of Google Spreadsheets as a data source and a simple web interface to add interactivity it’s possible to let users explorer your entire event hashtag and replay any of conversations. View example conversation replay Try out a LIVE version. 10 tools that can help data journalists do better work, be more efficient. It’s hard to be equally good at all of the tasks that fall under data journalism.
To make matters worse (or better, really), data journalists are discovering and applying new methods and tools all the time. As a beginning data journalist, you’ll want to develop a sense of the tools others are using to do the work you admire. You won’t be able to learn them all at once, and you shouldn’t try. You should, however, develop a sort of ambient awareness of the tools in use (something like the knowledge Facebook gives you about the lives of your high-school classmates). TableTools2 - Copy/Sort/Chart/Filter Table&More! Computational and Data Journalism. ZAPP - Recherche: Datenjournalismus. Datenjournalismus. Hacks and hackers gather to write the first Data Journalism Handbook. The following post is from Federica Cocco, a freelance journalist and the former editor of Owni.eu, a data-driven investigative journalism site based in Paris. She has also worked with Wired, Channel 4 and the Guardian. It is cross posted on DataDrivenJournalism.net and on the Data Journalism Blog.
Ravensbourne College is an ultramodern cubist design school which abuts the O2 arena on the Greenwich peninsula. It is perhaps an unusual and yet apt setting for journalists to meet. Members of the Open Knowledge Foundation and the European Journalism Centre saw this as a perfect opportunity to herd a number of prominent journalists and developers who, fuelled by an unlimited supply of mocacchinos, started work on the first Data Journalism Handbook.
The occasion was the yearly Mozilla Festival, which acts as an incubator to many such gatherings. Timetric.
TileMill. Indiemapper. Quellen. Visualisierung.