
Projects. "bad. Anscombe's quartet. All four sets are identical when examined using simple summary statistics, but vary considerably when graphed Anscombe's quartet comprises four datasets that have nearly identical simple statistical properties, yet appear very different when graphed.
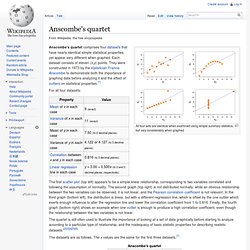
Each dataset consists of eleven (x,y) points. They were constructed in 1973 by the statistician Francis Anscombe to demonstrate both the importance of graphing data before analyzing it and the effect of outliers on statistical properties.[1] For all four datasets: Collaborative Statistics. The Joy of Stats available in its entirety. Khan Academy. Think like a statistician – without the math. I call myself a statistician, because, well, I'm a statistics graduate student.
However, ask me specific questions about hypothesis tests or required sampling size, and my answer probably won't be very good. The other day I was trying to think of the last time I did an actual hypothesis test or formal analysis. I couldn't remember. GAISE Reports. Welcome to Visible Statistics!