
Procedure and Policy Software for Admin, Customer Service, IT, Finance, HR. Document Your Standard Operating Procedures With Ease. Piktochart Infographics Gallery. Login Sign Up Over 600 Templates To Make Information Beautiful A library of professionally designed templates, all with amazing visual appeal and comprehensive layouts.
Get Started View Preview Infographics Create long-form infographics that draw more page views to your blog or website, and watch traffic skyrocket. View 200 more Get Started View Preview Presentation Delight and blow your prospects away with visually-enticing infographics, which can be presented on slideshows with our Presentation Mode. Get Started View Preview Printables Enhance your posters and reports and spread information at a glance. Show All Scroll. SmartDraw is the Smartest Way to Draw Anything. Save your Kindle Notes and Highlights - MyClippings.txt. Mijntranscript. Wie Zijn Wij?
MijnTranscript is DE transcriptieservice-provider in Nederland voor alle zaken gerelateerd aan transcriptiewerkzaamheden. De organisatie is ontstaan vanuit het idee de transcriptieservice wereldwijd zo goed en zo betaalbaar mogelijk op te zetten. Transcriberen is voor veel mensen een frustrerende taak, maar indien u uw opgenomen geluidsbestanden toch in document vorm wenst te hebben, dan wilt u dit natuurlijk zo goed en zo vertrouwelijk mogelijk laten gebeuren – het liefst niet tegen het torenhoge tarief dat in Nederland door veel bedrijven gerekend wordt voor een transcript.
MijnTranscript is er dan ook voor u! Hoe zijn wij in staat zo’n scherp tarief te leveren tegen een goede kwaliteit? Here’s How Managers Can Be Replaced by Software. Fortune 500 executives spend a fair amount of time thinking about how automation and the Internet are changing the nature of employment, but they rarely wonder how technology will have an impact much closer to home: on their own jobs.

For the last several years, we have been studying the forces now shaping the future of work, and wondering whether high-level management could be automated. This inspired us to create prototype software we informally dubbed “iCEO.” As the name suggests, iCEO is a virtual management system that automates complex work by dividing it into small individual tasks. iCEO then assigns these micro-tasks to workers using multiple software platforms, such as oDesk, Uber, and email/text messaging. Basically, the system allows a user to drag-and-drop “virtual assembly lines” into place, and run them from a dashboard. But could iCEO manage actual work projects for our organization? It’s easy to imagine this software used in many other industries. JustPaste.it - Deel teksten en foto’s op een eenvoudige manier.
Dan Mason » Three of the best iPad voice recorder apps for journalists and bloggers. Prijsmodel Invoice Management Online. Het prijsmodel van Invoice Management Online is gebaseerd op maandabonnementen.
Ieder bedrijf sluit een eigen abonnement af voor het gebruik van onze software. Het abonnement geeft recht op: De gehele verwerking van een x-aantal facturen (per maand) van ontvangst tot en met archiveringOnbeperkt aantal gebruikers en administratiesMinimale bewaartermijn van 7 jaarInclusief opstart (op afstand)Inclusief support Binnen je abonnement heb je iedere maand een x-aantal facturen tot je beschikking. Indien je in een maand facturen overhoudt, neem je deze facturen onbeperkt mee naar volgende maanden. Rekenvoorbeeld; Je werkt drie maanden met Invoice Management en je hebt een abonnement voor 25 facturen per maand à € 20,- per maand. De prijzen genoemd in deze prijslijst zijn indicatief en exclusief BTW. Online Accounting Software. How to make an interactive D3.js visualization using datamatic.io. How to make an interactive D3.js visualization using datamatic.io Datamatic.io is a visualization generator based on the amazing D3.js library.
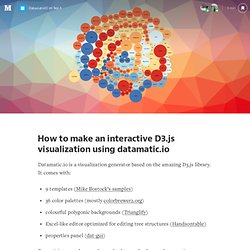
It comes with: 9 templates (Mike Bostock’s samples)36 color palettes (mostly colorbrewer2.org)colourful polygonic backgrounds (Trianglify)Excel-like editor optimized for editing tree structures (Handsontable)properties panel (dat-gui) By remixing templates, palettes, backgrounds, data and properties, you can create all kinds of visualizations as if you were using an Excel file with a dash of PowerPoint.
Here is an example of how to create a visualization showing demographic data Go to datamatic.io and sign in using your Google account. 2. You can copy/paste from Excel/Google sheets or add data manually you can add hierarchical data using the data editor breadcrumb 3. We’re going to choose “Dynamic Bubble Chart” as it shows hierarchical data in an interactive, “zoomable” way you should see something like this: 4. Choose color palette More resources:
Katalict. Automate Your Infusionsoft Appointments.