
Make Data Analysis Visual With Maps. Targets, Learning Gaps and Flight Paths. For many of us #SLTChat on a Sunday evening has become an addictive part of the weekend.
It is often an action packed and adrenaline fuelled outpouring of tweets and ideas with some of the most rapid sharing of practice you will ever find. The most popular question on the 22nd September, hence it was topic 2, is below: Last academic year I ran a session on outstanding teaching & learning for staff. An early part of the CPD was focussed on unpacking the idea of measuring “progress over time”. The basic idea is that students who are taught well make more progress than those who are not. The linear nature of these flight paths didn’t go down well with all tweeters and the comments about the non-linear nature of learning is valid. However, over a year, key stage or whole primary or secondary school education the peaks and troughs of non-linear learning need to lead overall to a student making good progress. Flight Paths Accountable Against Outcomes Not Targets Targets & Learning Gaps Like this:
4Matrix. Flight Path tool preview Here is the Flight Path tool which we are just about to release as a free update.
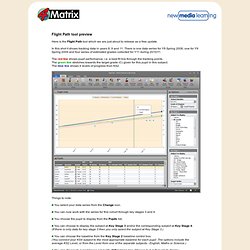
In this shot it shows tracking data in years 8, 9 and 11. There is one data series for Y8 Spring 2008, one for Y9 Spring 2009 and four series of estimated grades collected for Y11 during 2010/11. The red line shows pupil performance, i.e. a best fit line through the tracking points. The green line stretches towards the target grade (C) given for this pupil in this subject. Working with data – the narrative in the numbers.
I covet @Ashley_Loynton’s mug It is a constant source of amusement and bafflement to my colleagues how much I love working with data.
As an English specialist I’m not supposed to enjoy the spreadsheets and pie charts quite as much as I do. However, it’s my firm belief that data helps me to be a better teacher, and that my work with data as a member of SLT helps my school become a better school. The principles of working with data When I first started blogging one of the first posts I read was Kev Bartle‘s excellent ‘Doing’ Data as a member of SLT. I don’t disagree with any of what Kev says in his post, as I’m sure you will see. Less is more – but don’t hide the restUse hard and soft data equallyLook for the narrative in the numbersMake the data work for you – don’t work for the data Working with data as a classroom teacher When I’m in the classroom I collect and use data that is relevant to me.
I could find out loads more about the students in that class. “Hard” data – academic attainment.