
R wordcloud. Home - RStudio. R. Learn R. Upload mybringback.com.
Axes and Text. Many high level plotting functions (plot, hist, boxplot, etc.) allow you to include axis and text options (as well as other graphical paramters).
For example # Specify axis options within plot() plot(x, y, main="title", sub="subtitle", xlab="X-axis label", ylab="y-axix label", xlim=c(xmin, xmax), ylim=c(ymin, ymax)) For finer control or for modularization, you can use the functions described below. Titles Use the title( ) function to add labels to a plot. R Introduction. We offer here a couple of introductory tutorials on basic R concepts.
It serves as background material for our main tutorial series Elementary Statistics withR. The only hardware requirement for most of the R tutorials is a PC with the latest free open source R software installed. List. A list is a generic vector containing other objects.
For example, the following variable x is a list containing copies of three vectors n, s, b, and a numeric value 3. > n = c(2, 3, 5) > s = c("aa", "bb", "cc", "dd", "ee") > b = c(TRUE, FALSE, TRUE, FALSE, FALSE) > x = list(n, s, b, 3) # x contains copies of n, s, b List Slicing We retrieve a list slice with the single square bracket "[]" operator. The following is a slice containing the second member of x, which is a copy of s. Data Science Specialization.
SparkR (R on Spark) - Spark 1.4.0 Documentation. SparkR is an R package that provides a light-weight frontend to use Apache Spark from R.
In Spark 1.4.0, SparkR provides a distributed data frame implementation that supports operations like selection, filtering, aggregation etc. RStudio – Webinars. Webinars On Demand Webinars are presented on a variety of subjects.
We will cover packages, products (both Open Source & Commercial), have guest presenters, as well as general Q&A “Office Hour” recordings. All materials will be made available and at no cost. HarvardX Biomedical Data Science. We recently received funding from the NIH BD2K initiative to develop MOOCs for biomedical data science.
Our first offering is the eight course series: Data Analysis for Genomics. The series provides different entry points for students with different levels of expertise. An R Introduction to Statistics. Analyzing the World of Analytics. Introduction to Statistical Learning. Togaware: Hands-On Data Science with R. One Page R: A Survival Guide to Data Science with R. Children Growth Charts. In the graphs below a series of percentile curves illustrate the distribution of selected body measurements in children.
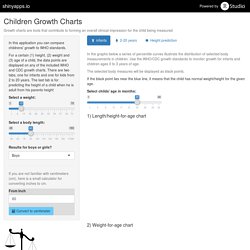
Use the WHO/CDC growth standards to monitor growth for infants and children ages 0 to 3 years of age.The selected body measures will be displayed as black points. If the black point lies near the blue line, it means that the child has normal weight/height for the given age. 1) Length/height-for-age chart 2) Weight-for-age chart Disclaimer These tables are published without warranty of any kind, either express or implied. PracticalMachineLearning/PML_Report.Rmd at master · tatjanatd/PracticalMachineLearning. Developing Data Products. Developing_Data_Products_Project : Course Project.
Developing Data Products Course Project. Developing Data Prods Presentation on Predicting Heights Application. Practical Machine Learning Course Project. Practical Machine Learning Course Project. Course Project-Practical Machine Learning. Coursera - Practical Machine Learning Assignment. Qualitative Evaluation of Human Activities. Practical Machine Learning Project. Machine Learning Part 1. Machine Learning Part 3. Machine Learning Part 2. Machine Learning Final Project. Graphviz. Install. Using Bioconductor The current release of Bioconductor is version 3.1; it works with R version 3.2.0.
Users of older R and Bioconductor versions must update their installation to take advantage of new features. Install the latest release of R, then get the latest version of Bioconductor by starting R and entering the commands source(" biocLite() Details, including instructions to install additional packages and to update, find, and troubleshoot are provided below. Install R Download the most recent version of R. . [ Back to top ] Install Bioconductor Packages Use the biocLite.R script to install Bioconductor packages. Install specific packages, e.g., “GenomicFeatures” and “AnnotationDbi”, with biocLite(c("GenomicFeatures", "AnnotationDbi")) The biocLite() function (in the BiocInstaller package installed by the biocLite.R script) has arguments that change its default behavior; type ?
Quick-R: Home Page. Linear Algebra Examples. Now we are ready to see how matrix algebra can be useful when analyzing data.
We start with some simple example and eventually get to the main one: how to write linear models with matrix algebra notation and solve the least squares problem. RStudio – Webinars. Spark Summit. PH525x series - Biomedical Data Science. Data Scientists. RDataMining: R and Data Mining. The caret Package. This page shows a network diagram of all the models that can be accessed by caret's train function. See the Revolutions blog for details about how this visualization was made (and has this page has updated code using thenetworkD3 package). In summary, the package annotates each model by a set of tags (e.g. Data Analysis Examples. The pages below contain examples (often hypothetical) illustrating the application of different statistical analysis techniques using different statistical packages.
Each page provides a handful of examples of when the analysis might be used along with sample data, an example analysis and an explanation of the output, followed by references for more information. These pages merely introduce the essence of the technique and do not provide a comprehensive description of how to use it. The combination of topics and packages reflect questions that are often asked in our statistical consulting. R Data Analysis Examples: Logit Regression. Logistic regression, also called a logit model, is used to model dichotomous outcome variables. In the logit model the log odds of the outcome is modeled as a linear combination of the predictor variables. This page uses the following packages. Make sure that you can load them before trying to run the examples on this page.
If you do not have a package installed, run: install.packages("packagename"), or if you see the version is out of date, run: update.packages(). Coursera-regression-models/index.Rmd at master · butlermh/coursera-regression-models. Data Analysis in the Geosciences. 19 October 2011 After you perform a regression, calling plot() or plot.lm() on that regression object brings up four diagnostic plots that help you evaluate the assumptions of the regression. How to interpret these plots is best shown by comparing a regression in which the assumption are met with those in which the assumptions are violated. Recall that a least-squares regression assumes that the errors (residuals) are normally distributed, that they are centered on the regression line, that their variance doesn't change as a function of x. Case 1: A good regression First, let’s start with a good regression, one in which all of the assumptions of the regression are met.
Note that the points lie around the line along the total length of the line, that the amount of variation around the line doesn't change along the length of the line, and that there are no outliers (single points that lie far from the line). Paramètres des graphes. / Graphiques. / Aide mémoire R. Google Traduction. Google Traduction. RPubs - Practical Machine Learning Course Assignment. Mtcars Regression. RPubs - mtcars Regression. RPubs - Nocti. RPubs - Machine Learning. Predict Next Word in the Sentence: RPubs. Programme MatLab [Thierry Denoeux] Abcd'R - astuces et Scripts R. Club des développeurs R : cours, forum, FAQ, programmation.
Cours Programmation R. Le langage R Markdown. Introduction au langage R et à RStudio. Introduction à Rcommander. Gestion des données avec R. Introduction à R. Data Science with R TEXTMINING etc. Analyze Core. Although the sankey diagram from the previous post provided us with a very descriptive tool, we can consider it a rather exploratory analisys.
As I mentioned, sequence mining can give us the opportunity to recommend this or that product based on previous purchases, but we should find the right moment and patterns in purchasing behavior. Therefore, the sankey diagram is not enough as it doesn’t show the duration between purchases. The other challenge is to understand that the customer has left us or just hasn’t made his/her next purchase yet. Therefore, in this post you will find technics which can help you to find patterns in customer’s behavior and churn based on purchase sequence. And you will find several interesting visualizations. Swirl: Learn R, in R. Graphiques avec R. The French version of this document is no longer maintained: be sure to check the more up-to-date English version. Machine Learning Repository.
Courses/02_RProgramming at master · rdpeng/courses. [R] itemset mine coursera. Market Basket Analysis with R : Salem Marafi. Posted by Salem on March 19, 2014. DataScienceSpecialization/DataScienceSpecialization.github.io · GitHub. Chapitre 2 — La Loi Normale. Statistiques > L'objectif du chapitre est de présenter la loi normale qui est le modèle probabiliste le plus utilisé pour décrire de très nombreux phénomènes observés dans la pratique.
Une grande attention devra être accordée aux concepts, essentiels en statistiques, d'espérance mathématique et de variance et aux opérations qui leurs sont attachées. BioStatistique Lyon1. Se connecter à Facebook. Single-user OAuth with Examples. Learning Data Science : R et Twitter. On va dans ce post, illustrer une utilisation simple des packages twitteR, StreamR, tm qui permettent faire du textmining. En réalité, les deux premiers permettent de récuperer les tweets et de faire des comptages simples et complexes et le dernier permet de faire du textmining; On reviendra plus en détail sur ce dernier dans un prochain billet. Google Traduction. RPubs. Caching Code Chunks. Options: Chunk options and package options. The knitr package shares most options with Sweave, but some were dropped/changed and some new options were added. The default values are in the parentheses below.
Note that the chunk label for each chunk is assumed to be unique, i.e., no two chunks share the same label. This is especially important for cache and plot filenames. Chunks without labels will be assigned labels like unnamed-chunk-i where i is the chunk number. Customizing Chunk Options. Plyr: Split-Apply-Combine for Mortals. Database Access. Voir le sujet - melt/reshapre avec beaucoup de variables ? Groupe des utilisateurs du logiciel R. Do more with dates and times in R with lubridate 1.1.0. Web Scrapping. Web scraping. Coursera. Lessons learned from teaching an 11-week data science course. How to Gather Quantitative Data on User Behaviors. Introduction to R Seminar. Webinars - RStudio.