
Advanced Neuroimaging 2016 Summer Program. The (Video) for any lecture links to a recorded video.
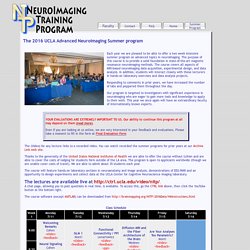
You can watch recorded the summer programs for prior years at our Archive Link web site. Thanks to the generosity of the United States National Institutes of Health we are able to offer the course without tuition and are able to cover the costs of lodging for students form outside of the LA area. The program is open to applicants worldwide (though we are unable cover costs of travel). We are able to admit about 35 students each year. The course will feature hands-on laboratory sections in neuroanatomy and image analysis, demonstrations of EEG-fMRI and an opportunity to design experiments and collect data at the UCLA Center for Cognitive Neuroscience imaging laboratory. The lectures are available live at A chat page, allowing you to post questions in real time, is available. Home at Structural Brain Mapping Group.
Data Processing Assistant for Resting-State fMRI (DPARSF) V3.2. Data Processing Assistant for Resting-State fMRI (DPARSF) is a convenient plug-in software within DPABI, which is based on SPM.
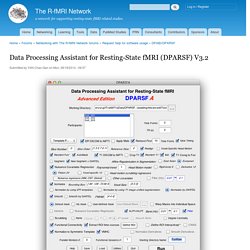
You just need to arrange your DICOM files, and click a few buttons to set parameters, DPARSF will then give all the preprocessed (slice timing, realign, normalize, smooth) data, functional connectivity, ReHo, ALFF/fALFF, degree centrality, voxel-mirrored homotopic connectivity (VMHC) results. DPARSF can also create a report for excluding subjects with excessive head motion and generate a set of pictures for easily checking the effect of normalization. You can use DPARSF to extract ROI time courses efficiently if you want to perform small-world analysis. DPARSF basic edition is very easy to use while DPARSF advanced edition (alias: DPARSFA) is much more flexible and powerful. DPARSFA can parallel the computation for each subject, and can be used to reorient your images interactively or define regions of interest interactively. 1. 2.
Neuromorphometrics. Extracting values from fMRI ROIs. Fs.roi.pdf. CorticoMetrics. Bruce Fischl, Ph.D.
Co-Founder Bruce Fischl, Ph.D., co-founded the company in 2012, driven by the desire to translate the research in his lab into the hands of clinicians, based on observation of the shortcomings of the tools available to clinicians at area hospitals. He is a Professor in Radiology, Harvard Medical School, and Neuroscientist, Massachusetts General Hospital. His research involves the development of novel techniques for the generation of models of neuroanatomical structures using MRI.
This includes the automatic construction of geometrically accurate and topologically correct models of the human cerebral cortex: the basis of ‘FreeSurfer’, the world-renowned neuroimaging analysis software package. Dr. 2007 UCLA Advanced Neuroimaging Summer School - Week 1 - Download free content from UCLA. Principal Investigators (PIs) Neuroimaging tools. Normal Brain Data Base. BrainInfo. Complete a region of interest (ROI) analysis in FSL (FEATQUERY) and summarize the output for analysis (FSL)
You want to do a region of interest analysis, and you want it be automated.
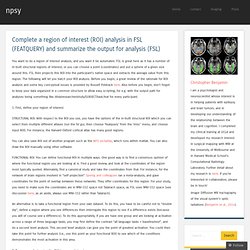
FSL is great here as it has a number of in-built structural regions of interest, or you can choose a point (coordinates) and put a sphere of a given size around this. FSL then projects this ROI into the participant’s native space and extracts the average value from this region. The following will let you batch your ROI analysis. Before you begin, a great review of the rationale for ROI analysis and some key conceptual issues is provided by Russell Poldrack here.
Also before you begin, don’t forget to keep your data organized in a common structure to allow easy scripting; for e.g. with the output path for analyses being something like /disk/researcher/study/SUBJECT/task.feat for every participant. 1. You can also save ROI out of another program such as the WFU pickatlas, which runs within matlab. FSL Archives. Bramen_ROI-Lab - Bramen_ROI-Lab.pdf. PSYCH290Z - Lab 2 - FSL. Center for Brain Science. Quality Control Overview Slides from workshop on QC.
NeuroWiki:Current developments - NeuroWiki. Eyetracking with MRI Marcus Spaan, Thomas Knapen & Renee Visser The eyetracker is now fully operational.
Further information can be obtained by Marcus Spaan. Run MELODIC to identify components of timeseries. Allen Brain Atlas - Welcome. Scribe. The CogNeuroStats Blog. Scheda Docente. Stochastic Event Synchrony (SES) Toolbox. SES Toolbox webpage Home FAQ Download Discussion group Contact us Welcome to the SES project homepage!
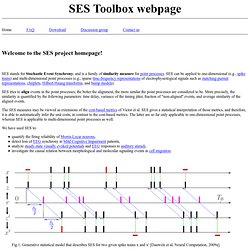
SES stands for Stochastic Event Synchrony, and is a family of similarity measure for point processes. SES can be applied to one-dimensional (e.g., spike trains) and multi-dimensional point processes (e.g., sparse time-frequency representations of electrophysiological signals such as matching-pursuit representations, chirplets, Hilbert-Huang transforms, and bump models). SES tries to align events in the point processes; the better the alignment, the more similar the point processes are considered to be.
Neuroimaging Made Easy. The nuts & bolts: Resting state fMRI confounds. (Thanks to Dave J.

Hayes for tweeting the publication of these papers.) Two new papers provide comprehensive reviews of some of the confounds to the acquisition, processing and interpretation of resting state fMRI data. In the paper, "Resting-state fMRI confounds and cleanup," Murphy, Birn and Bandettini consider in some detail many of the noise sources in rs-fMRI, especially those having a physiologic origin. In "Overview of potential procedural and participant-related confounds for neuroimaging of the resting state," Duncan and Northoff review the effects that other circumstantial factors, such as the scanner's acoustic noise, subject instructions, subjects' emotional state, and caffeine might have on rs-fMRI studies. Neuroimaging in Python - Pipelines and Interfaces — nipy pipeline and interfaces package. DesignEfficiency - MRC CBU Imaging Wiki.
This page tries to address the question of how to design fMRI experiments that are sensitive to (efficient for) a specific hypothesis (i.e, statistical planned comparison or "contrast").
The properties of the BOLD signal measured by fMRI - particularly its "sluggish" nature - can make the design of efficient experiments difficult to intuit. This page starts with some general advice, before explaining the reasons for this advice from the perspectives of 1) signal-processing, 2) mathematics, 3) correlations between regressors. It is hoped that at least one of these different perspectives will aid your intuitions. It finishes with some common questions that I have come across. Talairach.org. Brainmap.org. Brede Database, DTU Informatics, Denmark.
Splash Page. Marchini's Homepage. Popgen popgen is an R package that implements some statistical and population genetics methods.
A poster presented at SMBE 2003 conference which describes the package can be downloaded here. The package is available from CRAN AnalyzeFMRI AnalyzeFMRI is an R package that provides I/O, visualisation and analysis of functional Magnetic Resonance Imaging (fMRI) datasets stored in the ANALYZE image format. Datasets can be read into R in several different ways i.e. one slice, one time series, whole dataset etc and displayed quickly and simply using a tcl/tk GUI (Graphical User Interface). FreeSurfer. AFNI Main Page — AFNI and NIfTI Server for NIMH/NIH/PHS/DHHS/USA/Earth.
Document Actions AFNI and SUMA Information Central. Brain Innovation - Home. BAMM (Brain Activation and Morphological Mapping), Brain Mapping Unit, University of Cambridge. BAMM is a software library for the statistical analysis of functional and structural (dual-echo) magnetic resonance images (MRI) of the human brain. BAMM is freely available to academic users and can be downloaded from this site. BAMM source code is written in C/C++ for computational speed. The statistical methods incorporated in the software are documented in peer-reviewed publications.
Chris Rorden's Neuropsychology Lab. One neurological mystery is that injury to the right hemisphere can lead to different patterns of perceptual problems. While this has lead some to despair that terms like ‘spatial neglect’ are a meaningless entity (as two patients with “neglect” may have very different symptoms and prognosis), we argue that these differences actually reflect different patterns of brain injury. Therefore, the myriad of symptoms actually reveals different brain functions, providing insights into the modularity of brain function. We describe this in a review article published in Neuropsychologia, which summarizes the work from many teams and reveals a growing consensus regarding these functions. Dr Kathleen Pirog Revill has published an article in the journal NeuroImage. Chris Rorden's Neuropsychology Lab. MRIcron Peristimulus Plots. Introduction SPM and FSL are powerful tools for analyzing fMRI data. However, the statistical maps most people generate with these tools can be difficult to interpret.
Generating peristimulus plots can allow you to get a better idea of what your data actually looks like, and can help you determine if a region shows an increased amplitude of activity or a more sustained response to a stimuli. To generate peristimulus plots you will need: MRIcron. Extensible Neuroimaging Archive Tool. Forum of resting-state fMRI (静息态功能磁共振成像论坛)