
Data Demystified – Equipping you with the information you need to thrive in our data rich world. Percent Changes Explained in the Stock Market When the pandemic started taking hold in the US back in February, many of us probably remember that the stock market tanked.

Statistics Help for Students. Tutorsquickguidetostatistics. Confusing Stats Terms Explained: Residual — Stats Make Me Cry Consulting. When I hear the word "residual", the pulp left over after I drink my orange juice pops into my brain, or perhaps the film left on the car after a heavy rain.
However, when my regression model spits out an estimate of my model's residual, I'm fairly confident it isn't referring to OJ or automobile gunk...right? Scrutinizing science: Peer review. Peer review does the same thing for science that the "inspected by #7" sticker does for your t-shirt: provides assurance that someone who knows what they're doing has double-checked it.
In science, peer review typically works something like this: A group of scientists completes a study and writes it up in the form of an article. They submit it to a journal for publication. The journal's editors send the article to several other scientists who work in the same field (i.e., the "peers" of peer review). Those reviewers provide feedback on the article and tell the editor whether or not they think the study is of high enough quality to be published. The authors may then revise their article and resubmit it for consideration.
Peer review and publication are time-consuming, frequently involving more than a year between submission and publication. Peer-reviewed articles provide a trusted form of scientific communication. TypesofArticle. Review AP Stats. Welcome to the Statistical Matrix. Welcome to the Euclid's Statistical Matrix!
This is a Multiilingual Dashboard designed to assist in the teaching and learning of the basics of statistics. The Matrix includes 4 outstanding youtube courses and an excellent ebook by David Lane. It is also multilingual with an Arabic Course by Dr. Serageldin and an Arabic RMLA. Videos from each series line up across the Matrix rows based on similar video content so that if a student or teacher has difficulty with lecture on hypothesis testing video, they can look at videos on the same topic from other instructors. Introduction to Statistics. Difference Between Stratified and Cluster Sampling (with Comparison Chart) - Key Differences. In our earlier article, we’ve discussed probability and non-probability sampling, in which we came across types of probability sampling, i.e.
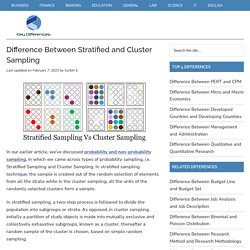
Stratified Sampling and Cluster Sampling. UsableStats: Statistics Tutorials. The Largest Vocabulary in Hip Hop. (ps.
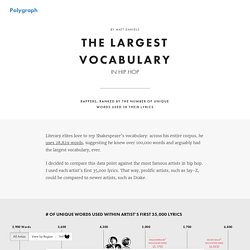
Get this project as a poster on Pop Chart Lab! It includes 40 more rappers in the analysis, including Childish Gambino, 2 Chainz, Immortal Technique, and Kendrick Lamar.) 35,000 words covers 3-5 studio albums and EPs. I included mixtapes if the artist was just short of the 35,000 words. Quite a few rappers don’t have enough official material to be included (e.g., Biggie, Kendrick Lamar). I used a research methodology called token analysis to determine each artist’s vocabulary. Dictionary of Statistics. Types of Statistical Tests. After looking at the distribution of data and perhaps conducting some descriptive statistics to find out the mean, median, or mode, it is time to make some inferences about the data.
As mentioned previously, inferential statistics are the set of statistical tests researchers use to make inferences about data. These statistical tests allow researchers to make inferences because they can show whether an observed pattern is due to intervention or chance. There is a wide range of statistical tests. Glossary for Statistical Methods for Psychology, 6th ed. This glossary is a compilation of the definitions of keywords found throughout Fundamental Statistics for the Behavioral Sciences, 7th edition and Statistical Methods for Psychology; 7th edition.
It was suggested by D.K. Bauman at Valdosta State University, and I will try to make it a regular part of future editions of the book. I have omitted a few technical terms that do not make much sense out of context. There are several other glossaries on the web. The Best Statistics Books Of All-Time - “What are the best books about Statistics?”
Prob StatVocab. Basic statistical tools in research and data analysis. Statistics. Scatter plots are used in descriptive statistics to show the observed relationships between different variables.
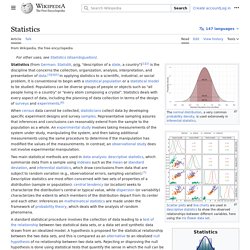
Statistics is a branch of mathematics dealing with data collection, organization, analysis, interpretation and presentation.[1][2] In applying statistics to, for example, a scientific, industrial, or social problem, it is conventional to begin with a statistical population or a statistical model process to be studied. List of Statistical Procedures. This page presents a list of the statistical, graphics, and data analysis procedures available in NCSS. For a more in-depth look at the features of a procedure, please download the free trial of NCSS.
Click to see some additional details about regression analysis, comparing means, crosstabs and proportions, mass appraisal, curve fitting, time series and forecasting, clustering, quality control, or survival analysis in NCSS. You can also see a complete list of all the statistical data analysis tools, procedures, tests, graphics and calculations available in NCSS Statistical Software. Annex 1 Statistical tools and techniques 001 1.