
The Formula for Chi-Square Statistic. The chi-square statistic measures the difference between actual and expected counts in a statistical experiment.
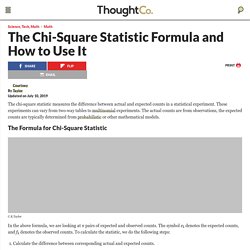
These experiments can vary from two-way tables to multinomial experiments. The actual counts are from observations, the expected counts are typically determined from probabilistic or other mathematical models. Chi Square Statistics. Types of Data: There are basically two types of random variables and they yield two types of data: numerical and categorical.
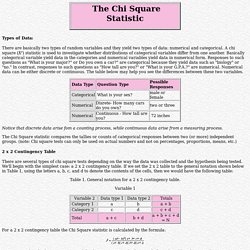
A chi square (X2) statistic is used to investigate whether distributions of categorical variables differ from one another. Basically categorical variable yield data in the categories and numerical variables yield data in numerical form. Responses to such questions as "What is your major? " or Do you own a car? " Notice that discrete data arise fom a counting process, while continuous data arise from a measuring process. The Difference Between a Chi-Square Test and a McNemar Test - The Analysis Factor. You may have heard of McNemar tests as a repeated measures version of a chi-square test of independence.
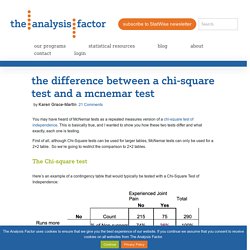
This is basically true, and I wanted to show you how these two tests differ and what exactly, each one is testing. First of all, although Chi-Square tests can be used for larger tables, McNemar tests can only be used for a 2×2 table. So we’re going to restrict the comparison to 2×2 tables. The Difference Between a Chi-Square Test and a McNemar Test - The Analysis Factor. Use and Interpret Rank Biserial Correlation in SPSS. An overview of correlation measures between categorical and continuous variables. Correlation - How to correlate ordinal and nominal variables in SPSS? Chi-Square - Department of Sociology - The University of Utah. Learning Objectives Understand the characteristics of the chi-square distribution Carry out the chi-square test and interpret its results Understand the limitations of the chi-square test Key Terms Chi-Square Distribution: a family asymmetrical, positively skewed distributions, the exact shape of which is determined by their respective degrees of freedomObserved Frequencies: the cell frequencies actually observed in a bivariate tableExpected Frequencies: The cell frequencies that one might expect to see in a bivariate table if the two variables were statistically independent Overview.

Mann-Whitney U Test Calculator. This is a simple Mann-Whitney U test calculator that provides a detailed breakdown of ranks, calculations, data and so on.
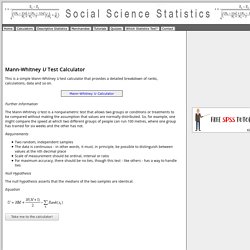
Further Information The Mann-Whitney U test is a nonparametric test that allows two groups or conditions or treatments to be compared without making the assumption that values are normally distributed. So, for example, one might compare the speed at which two different groups of people can run 100 metres, where one group has trained for six weeks and the other has not. Requirements Two random, independent samples The data is continuous - in other words, it must, in principle, be possible to distinguish between values at the nth decimal place Scale of measurement should be ordinal, interval or ratio For maximum accuracy, there should be no ties, though this test - like others - has a way to handle ties Null Hypothesis. The Chi-square test of independence. Data Analysis - Chi-squared test for nominal (categorical) data.
Effective analysis of reaction time data. Chi-square with ordinal data. David C.
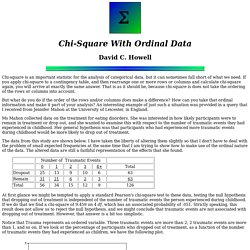
Howell Chi-square is an important statistic for the analysis of categorical data, but it can sometimes fall short of what we need. If you apply chi-square to a contingency table, and then rearrange one or more rows or columns and calculate chi-square again, you will arrive at exactly the same answer. How to do a Chi-square test when you only have proportions and denominators. By Annette Gerritsen, Ph.D.
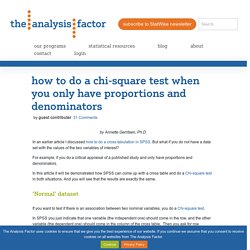
In an earlier article I discussed how to do a cross-tabulation in SPSS. Chi Square Statistics. Types of Data: There are basically two types of random variables and they yield two types of data: numerical and categorical.

A chi square (X2) statistic is used to investigate whether distributions of categorical variables differ from one another. Basically categorical variable yield data in the categories and numerical variables yield data in numerical form. Responses to such questions as "What is your major? " or Do you own a car? " Mendelian Genetics. An important question to answer in any genetic experiment is how can we decide if our data fits any of the Mendelian ratios we have discussed.
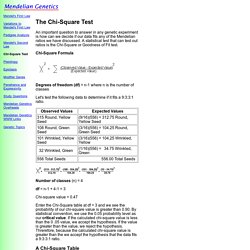
A statistical test that can test out ratios is the Chi-Square or Goodness of Fit test. Chi-Square Formula Degrees of freedom (df) = n-1 where n is the number of classes Let's test the following data to determine if it fits a 9:3:3:1 ratio. Number of classes (n) = 4. Chi-Square Goodness of Fit Test. This lesson explains how to conduct a chi-square goodness of fit test.
The test is applied when you have one categorical variable from a single population. It is used to determine whether sample data are consistent with a hypothesized distribution. For example, suppose a company printed baseball cards. It claimed that 30% of its cards were rookies; 60%, veterans; and 10%, All-Stars. Nonparametric Statistics - savage.pdf. How to Read Values on a Chi Square Critical Value Table. Skript. Kolmogorov-Smirnov test. The two-sample KS test is one of the most useful and general nonparametric methods for comparing two samples, as it is sensitive to differences in both location and shape of the empirical cumulative distribution functions of the two samples.
The Kolmogorov–Smirnov test can be modified to serve as a goodness of fit test. In the special case of testing for normality of the distribution, samples are standardized and compared with a standard normal distribution. This is equivalent to setting the mean and variance of the reference distribution equal to the sample estimates, and it is known that using these to define the specific reference distribution changes the null distribution of the test statistic: see below. Various studies have found that, even in this corrected form, the test is less powerful for testing normality than the Shapiro–Wilk test or Anderson–Darling test.[1] Full article ▸
Microsoft Word - Mann Whitney Example.doc - Mann-Whitney worked example.pdf. CHI-SQUARE TEST - 1210.pdf. Lectur13. Lecture 13 More on Chi-square There are several loose ends on chi-square that I would like to tie up. Simple Chi-square Problems My discussion thus far has primarily focused on the 2 X 2 contingency table which looks at the goodness-of-fit or the independence of two dichotomous variables.
I skipped a simpler example of chi-square which I would like to return to now. A very easy and simple example of chi-square is when the frequencies of response to one dichotomous variable are compared. For this, we have just one variable that is tested. Interactive Chi-Square Tests. An interactive calculation tool for chi-square tests of goodness of fit and independence © 2010-2014,Kristopher J.
Preacher. Statistics 101: Chi-square in Excel using College Enrollment Data. About the Chi-Square Test. Generally speaking, the chi-square test is a statistical test used to examine differences with categorical variables. There are a number of features of the social world we characterize through categorical variables - religion, political preference, etc. To examine hypotheses using such variables, use the chi-square test. The chi-square test is used in two similar but distinct circumstances:
Non-parametric tests - NonParametrics.pdf. Chi Squared Test. MathCaptain.com. Distributions. The assumptions made for Chi Square Test on single variance are, For the above test, the test statistic is calculated using the formula, \chi^{2} = (n-1)\frac{s^{2}}{\sigma ^{2}}. The critical values are suitable found from \chi^{2} tables, using the degrees of freedom and the type of the test left, right tailed or two-tailed. 7: Chi Square. Lesson 7. Interactive Chi-Square Tests. Chi-Square Goodness of Fit Test.
When an analyst attempts to fit a statistical model to observed data, he or she may wonder how well the model actually reflects the data. How "close" are the observed values to those which would be expected under the fitted model? Interpreting Chi-square. Chi-Square and Contingency Tables. Introductory Statistics: Concepts, Models, and Applications David W. Stockburger Hypothesis tests may be performed on contingency tables in order to decide whether or not effects are present. Effects in a contingency table are defined as relationships between the row and column variables; that is, are the levels of the row variable diferentially distributed over levels of the column variables.
Multiple Regression with Categorical Predictor Variables - Text. When a researcher wishes to include a categorical variable with more than two level in a multiple regression prediction model, additional steps are needed to insure that the results are interpretable. These steps include recoding the categorical variable into a number of separate, dichotomous variables. This recoding is called "dummy coding. " In order for the rest of the chapter to make sense, some specific topics related to multiple regression will be reviewed at this time. Correlated and Uncorrelated Predictor Variables Adding variables to a linear regression model will always increase the unadjusted R2 value.
If the additional predictor variables are uncorrelated (r = 0) with the predictor variables already in the model, then the result of adding additional variables to the regression model is easy to predict. The dummy coding can be done using SPSS/WIN and the "Transform," "Recode," and "Into different Variable…" options. Two things should be observed in the correlation matrix. Difference Between Poisson Distribution and Normal Distribution. Poisson Distribution vs Normal Distribution Poisson and Normal distribution come from two different principles. Poisson is one example for Discrete Probability Distribution whereas Normal belongs to Continuous Probability Distribution.
Normal Distribution is generally known as ‘Gaussian Distribution’ and most effectively used to model problems that arises in Natural Sciences and Social Sciences. Many rigorous problems are encountered using this distribution. Review of the Poisson Distribution. T-Tests, Chi-squares, Phi, Correlations: It’s all the same stuff - ho_correlation t phi.pdf.