
Visible Tweets – Twitter Visualisations. Now with added prettiness! National Park Maps Mashed Up with Google Maps > That's Mapdango! Live Twitts all over the world. Stweet - Latest Tweet for Paris. Twitter Co. Conversations. Real-time local Twitter trends - Trendsmap.
Monitter : real time, live twitter search and monitoring. The one million tweet map #onemilliontweetmap. Twistori. The geography of Tweets. Give every Twitter user a brush and they will paint you the world — if they geotag their Tweets.

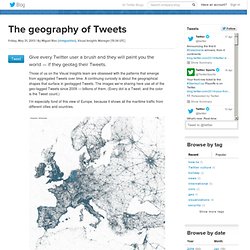
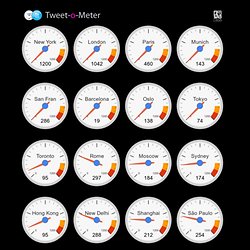
Those of us on the Visual Insights team are obsessed with the patterns that emerge from aggregated Tweets over time. A continuing curiosity is about the geographical shapes that surface in geotagged Tweets. The images we’re sharing here use all of the geo-tagged Tweets since 2009 — billions of them. (Every dot is a Tweet, and the color is the Tweet count.) I’m especially fond of this view of Europe, because it shows all the maritime traffic from different cities and countries. Seeing the clarity of the regional images led me to work up images for cities, too. Istanbul: Tokyo: New York: Tweet-o-Meter - Giving you an insight into Twitter activity from around the world! Is it true that, "New York is the city that never sleeps!

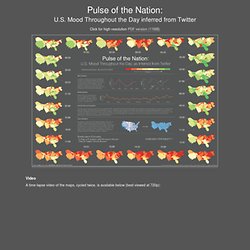
"? Do Londoners send more Tweets than New Yorkians'? Is Oslo a bigger Tweeter than Munich? Is Tokyo as much into Tweets as Barcelona? Has San Francisco calmed down after all that talk about the iPad? Tweet-o-Meter Knows! Welcome to Tweetminster. Twitterfall. All your news,updates and trends... In-A-Gist. Hashtagify.me - Search And Find The Best Twitter Hashtags - Free. Tweetree - Birds in a tree. Pulse of the Nation: U.S. Mood Throughout the Day inferred from Twitter. Click for high-resolution PDF version (11MB) Video A time-lapse video of the maps, cycled twice, is available below (best viewed at 720p): Mood Variations A number of interesting trends can be observed in the data.

First, overall daily variations can be seen (first graph), with the early morning and late evening having the highest level of happy tweets. Similar variations were discovered independently by Michael Macy and Scott Golder, and first reported in the talk "Answers in Search of a Question" at the New Directions in Text Analysis Conference in May 2010. Weekly Variations Weekly trends can be observed as well, with weekends happier than weekdays. About the Data and Visualization The plots were calculated using over 300 million tweets (Sep 2006 - Aug 2009) collected by MPI-SWS researchers [1], represented as density-preserving cartograms. About Cartograms A cartogram is a map in which the mapping variable (in this case, the number of tweets) is substituted for the true land area.
Coverage. Live Twitts all over the world. Mapping the global Twitter heartbeat: The geography of Twitter. TweetBeam Twitter Wall - Visualize Live Tweets. For Twitter. Twitter StreamGraphs. A StreamGraph is shown for the latest 1000 tweets which contain the search word.

The default search query is 'data visualization' but a new one can be typed into the text box at the top of the application. You can also enter a Twitter ID preceded by the '@' symbol to see the latest tweets from that user. A parameter to the URL can be used to specify the initial search word. For example, use to see the latest tweets about coffee.
Trentter - Realtime Twitter trends and tweets.