
AUTOMATED DISCOVERY OF SOCIAL NETWORKS IN ONLINE LEARNING COMMUNITIES. 47570_ch_16.pdf. 16824_Chapter_10.pdf. Linear Regression Analysis in SPSS Statistics - Procedure, assumptions and reporting the output. Introduction Linear regression is the next step up after correlation.
It is used when we want to predict the value of a variable based on the value of another variable. The variable we want to predict is called the dependent variable (or sometimes, the outcome variable). The variable we are using to predict the other variable's value is called the independent variable (or sometimes, the predictor variable). For example, you could use linear regression to understand whether exam performance can be predicted based on revision time; whether cigarette consumption can be predicted based on smoking duration; and so forth. This "quick start" guide shows you how to carry out linear regression using SPSS Statistics, as well as interpret and report the results from this test. SPSS Statisticstop ^ Assumptions Before we introduce you to these six assumptions, do not be surprised if, when analysing your own data using SPSS Statistics, one or more of these assumptions is violated (i.e., not met).
Interactive Mediation Tests. © 2010-2014,Kristopher J.
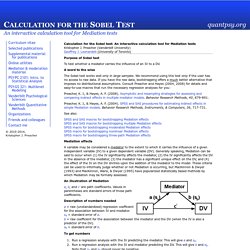
Preacher Calculation for the Sobel test: An interactive calculation tool for Mediation tests Kristopher J. Preacher (Vanderbilt University)Geoffrey J. Leonardelli (University of Toronto) Purpose of Sobel test To test whether a mediator carries the influence of an IV to a DV. A word to the wise The Sobel test works well only in large samples. Preacher, K. Preacher, K. See also: SPSS and SAS macros for bootstrapping Mediation effectsSPSS and SAS macros for bootstrapping multiple Mediation effectsSPSS macro for bootstrapping moderated Mediation effectsSPSS macro for bootstrapping nonlinear Mediation effectsSPSS macro for bootstrapping three-path Mediation effects Mediation effects A variable may be considered a mediator to the extent to which it carries the influence of a given independent variable (IV) to a given dependent variable (DV).
An illustration of Mediation a, b, and c' are path coefficients. Description of numbers needed To get numbers. Introduction to Mediation, Moderation, and Conditional Process Analysis - Andrew F. Hayes, Ph.D. Moderator Variables (David A. Kenny) David A.
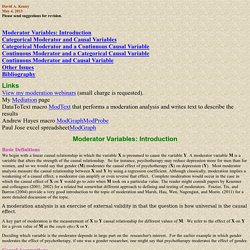
Kenny May 4, 2013 Please send suggestions for revision. Moderator Variables: Introduction Categorical Moderator and Causal Variables Categorical Moderator and a Continuous Causal Variable Continuous Moderator and a Categorical Causal Variable Continuous Moderator and Causal Variable Other Issues Bibliography View my moderation webinars (small charge is requested). My Mediation page DataToText macro ModText that performs a moderation analysis and writes text to describe the results Andrew Hayes macro ModGraphModProbe Paul Jose excel spreadsheetModGraph Moderator Variables: Introduction Basic Definitions We begin with a linear causal relationship in which the variable X is presumed to cause the variable Y. A moderation analysis is an exercise of external validity in that the question is how universal is the causal effect.
A key part of moderation is the measurement of X to Y causal relationship for different values of M. Y = i + aX + bM + cXM + E (1) Cell Coding Predicted Mean. Repeated Measures Analysis with SPSS. Statistical Computing Seminars Repeated Measures Analysis with SPSS The syntax file for this seminar.
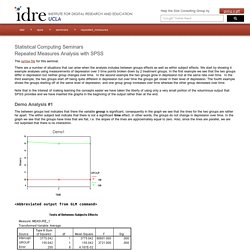
There are a number of situations that can arise when the analysis includes between groups effects as well as within subject effects. We start by showing 4 example analyses using measurements of depression over 3 time points broken down by 2 treatment groups. In the first example we see that the two groups differ in depression but neither group changes over time. In the second example the two groups grow in depression but at the same rate over time. Note that in the interest of making learning the concepts easier we have taken the liberty of using only a very small portion of the voluminous output that SPSS provides and we have inserted the graphs in the beginning of the output rather than at the end.
Demo Analysis #1. SPSS Library: Comparing Methods of Analyzing Repeated Measures Data. Comparing strategies of analyzing repeated measures data This page will examine how to analyze data from a repeated measures Analysis of Variance.
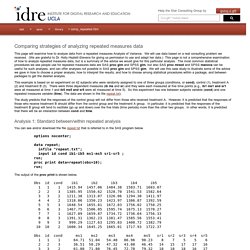
We will use data based on a real consulting problem we received. (We are grateful to Dr. Holly Hazlett-Stevens for giving us permission to use and adapt her data.) This page is not a comprehensive examination of how to analyze repeated measures data, but is a summary of the advice we would give for this particular analysis. This example is based on an experiment on 42 subjects who were randomly assigned to one of three groups (conditions, or cond), control (1), treatment A (2) and treatment B (3). The study predicts that the responses of the control group will not differ from those who received treatment A. Analysis 1: Standard between/within repeated analysis You can see and/or download the file repeat.txtthat is referred to in the SAS program below.