

Textmining. Ereputation. Dataviz. 50 Great Examples of Data Visualization. Wrapping your brain around data online can be challenging, especially when dealing with huge volumes of information.
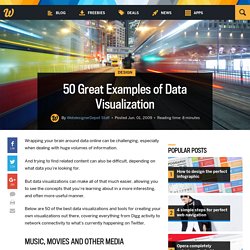
And trying to find related content can also be difficult, depending on what data you’re looking for. But data visualizations can make all of that much easier, allowing you to see the concepts that you’re learning about in a more interesting, and often more useful manner. Below are 50 of the best data visualizations and tools for creating your own visualizations out there, covering everything from Digg activity to network connectivity to what’s currently happening on Twitter. Music, Movies and Other Media Narratives 2.0 visualizes music.
Liveplasma is a music and movie visualization app that aims to help you discover other musicians or movies you might enjoy. Tuneglue is another music visualization service. MusicMap is similar to TuneGlue in its interface, but seems slightly more intuitive. Digg, Twitter, Delicious, and Flickr Internet Visualizations. 4 Promising Curation Tools That Help Make Sense of the Web. Steven Rosenbaum is a curator, author, filmmaker and entrepreneur.
He is the CEO of Magnify.net, a real-time video curation engine for publishers, brands, and websites. His book Curation Nation is slated to be published this spring by McGrawHill Business. As the volume of content swirling around the web continues to grow, we're finding ourselves drowning in a deluge of data. Where is the relevant material? Where are the best columns and content offerings? The solution on the horizon is curation. In the past 90 days alone, there has been an explosion of new software offerings that are the early leaders in the curation tools category. Datavisualization. Statistique décisionnelle, Data Mining, Scoring et CRM.
Blog eye tracking : ergonomie web, tests utilisateur. Le eye tracking comme outil pour la sécurité aérienne Le magazine belge L’écho publie aujourd’hui un article sur la technologie de eye tracking Pertech. Cet article présente l’oculomètre Pertech entre comme outil pour la sécurité aérienne. L’article est à télécharger au format pdf ici-même : Le eye tracking comme outil pour la sécurité aérienne Nouvelle version du site Pertech Notre site bénéficie d’une toute nouvelle version. Le eye tracker Pertech pour écrire avec les yeux Et si l’écriture avec les yeux n’était plus de la science-fiction? Ces projets de recherche ont donc abouti sur un système à base de eye tracking permettant d’écrire avec les yeux. Pertech et Jérôme Baujon dans le magazine de la CCI – Juin 2012 Jérôme Baujon présente Pertech dans le magazine de la CCI Sud Alsace du mois de Juin 2012 Conférence eye tracking Pertech – Bruxelles le 17 avril 2012 Qu’est-ce que le Eye-Tracking ?
Elle prend tout son sens dans la validation du comportement du sujet face à une tâche. Data Visualization Framework. Visuwords™ online graphical dictionary and thesaurus. The Best Data Visualization Projects of 2011. I almost didn't make a best-of list this year, but as I clicked through the year's post, it was hard not to.
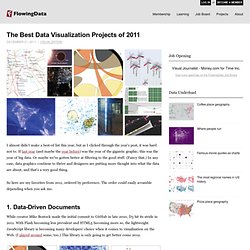
If last year (and maybe the year before) was the year of the gigantic graphic, this was the year of big data. Or maybe we've gotten better at filtering to the good stuff. (Fancy that.) In any case, data graphics continue to thrive and designers are putting more thought into what the data are about, and that's a very good thing.
So here are my favorites from 2011, ordered by preference. 1. While creator Mike Bostock made the initial commit to GitHub in late 2010, D3 hit its stride in 2011. 2. Who knew carrying around a stick that detects WiFi vertically could be so informative? 3. Media artist Roger Luke DuBois used online dating data to show the uniqueness of cities in America. 4. From Bloom, Planetary is an iPad app that visualizes your iTunes music as a solar system, bringing your data into a more playful and exploratory context. 5. 6. 7. Actuvisu Blog. DATA MINING. Supports de cours.
Cette page recense les supports utilisés pour mes enseignements de Machine Learning, Data Mining et de Data Science au sein du Département Informatique et Statistique (DIS) de l'Université Lyon 2, principalement en Master 2 Statistique et Informatique pour la Science des donnéEs (SISE), formation en data science, dans le cadre du traitement statistique des données et de la valorisation des big data.
Je suis très attentif à la synergie forte entre l'informatique et les statistiques dans ce diplôme, ce sont là les piliers essentiels du métier de data scientist. Attention, pour la majorité, il s'agit de « slides » imprimés en PDF, donc très peu formalisés, ils mettent avant tout l'accent sur le fil directeur du domaine étudié et recensent les points importants. Cette page est bien entendu ouverte à tous les statisticiens, data miner et data scientist, étudiants ou pas, de l'Université Lyon 2 ou d'ailleurs. Nous vous remercions par avance. Ricco Rakotomalala – Université Lyon 2. Web Squared Journal. Sipina - Arbres de décision.