
FedStats. An Atlas of Cyberspaces. This is an atlas of maps and graphic representations of the geographies of the new electronic territories of the Internet, the World-Wide Web and other emerging Cyberspaces.
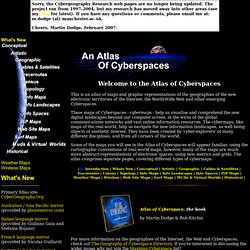
These maps of Cyberspaces - cybermaps - help us visualise and comprehend the new digital landscapes beyond our computer screen, in the wires of the global communications networks and vast online information resources. The cybermaps, like maps of the real-world, help us navigate the new information landscapes, as well being objects of aesthetic interest. They have been created by 'cyber-explorers' of many different disciplines, and from all corners of the world. Some of the maps you will see in the Atlas of Cyberspaces will appear familiar, using the cartographic conventions of real-world maps, however, many of the maps are much more abstract representations of electronic spaces, using new metrics and grids.
The atlas comprises separate pages, covering different types of cybermaps. (© Copyright - Martin Dodge, 2007. Thanks for trying the Visual Thesaurus. The Visual Thesaurus is an interactive dictionary and thesaurus that allows you to discover the connections between words in a visually captivating display.
With a subscription you will also get access to the Spelling Bee, VocabGrabber, and Online Magazine. 14 day risk-free trial! Visual Thesaurus Unlike a paper-bound book, the Visual Thesaurus is fluid and dynamic, like the way you think. Word maps blossom with meaning, helping you find just the right word. Subscribe Now Spelling Bee The Visual Thesaurus Spelling Bee will sharpen your spelling skills and expand your vocabulary. VocabGrabber Take any text and Vocabgrabber will instantly pull out the most useful vocabulary words and show you how those words are used in context. We Feel Fine / by Jonathan Harris and Sep Kamvar. Visual Design. We develop new ways to tell stories with data through visual representations.
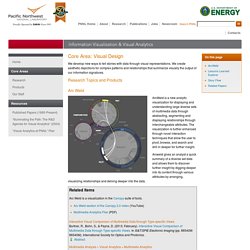
We create aesthetic depictions for complex patterns and relationships that summarize visually the output of our information signatures. Research Topics and Products Arc Weld ArcWeld is a new analytic visualization for displaying and understanding large diverse sets of multimedia data through abstracting, segmenting and displaying relationships through interchangeable attributes. The visualization is further enhanced through novel interaction techniques that allow the user to pivot, browse, and search and drill in deeper for further insight. Arcweld gives an analyst a quick summary of a diverse set data and allows them to discover further insight by digging deeper into its content through various attributes by arranging, visualizing relationships and delving deeper into the data.
Related Items Arc Weld is a visualization in the Canopy suite of tools. Burtner, R., Bohn, S., & Payne, D. (2013, February). Abstract. Mapping how people use a website. Mapping how people use a website A major challenge in designing and operating a large website is understanding how people use your site.
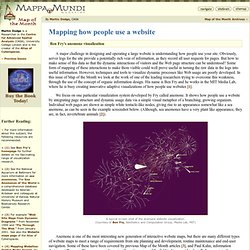
Obviously, server logs for the site provide a potentially rich vein of information, as they record all user requests for pages. But how to make sense of this data so that the dynamic interactions of visitors and the Web page structure can be understood? Some form of mapping of these interactions to make them visible could well prove useful in turning the raw data in the logs into useful information. However, techniques and tools to visualize dynamic processes like Web usage are poorly developed. We focus on one particular visualization system developed by Fry called anemone. Populated Information Terrains. Statistical methods An example of this approach is VR-VIBE , developed at Nottingham. This extends the VIBE approach into three dimensions and creates visualizations of bibliographies. Users specify keywords that they wish to use to generate the visualization and place these keywords in 3D-space.
TextArc.org Home. Reading Hamlet. Loom2 Work in Progress. Although constructed for researchers to share news and information, Usenet quickly developed into a social environment with varied styles of interactions.
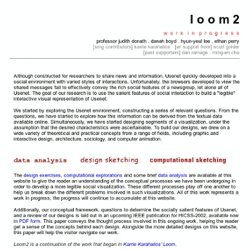
Unfortunately, the browsers developed to view the shared messages fail to effectively convey the rich social features of a newsgroup, let alone all of Usenet. The goal of our research is to use the salient features of social interaction to build a "legible" interactive visual representation of Usenet. We started by exploring the Usenet environment, constructing a series of relevant questions. From the questions, we have started to explore how this information can be derived from the textual data available online. MIT Media Lab. Data Portrait Study Series.
Sketch 3 (Spatial Portraiture: Space as Content and Medium): After various explorations with space, this sketch shows how one can build a medium to depict a person's relation to a physical environment.
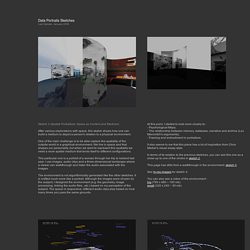
One of the main challenge is to be able capture the spatiality of the outside world in a graphical environment. We live in space and that shapes our personality, but when we want to represent this spatiality we need a more spatial medium that lends itself to different configurations. This particular one is a portrait of a woman through her trip to Iceland last year. I use images, audio clips and a three-dimensional landscape where a viewer can walkthrough and listen the audio associated with the images. The environment is not algorithmically generated like the other sketches. At this point, I started to look more closely to: - Psychological Maps, - The relationship between memory, database, narrative and archive (Lev Manovitch's arguments), - Framing and embodiment in portraiture.
SphereSite.