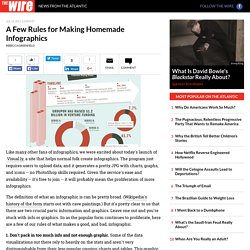

A Few Rules for Making Homemade Infographics. Like many other fans of infographics, we were excited about today's launch of Visual.ly, a site that helps normal folk create infographics.

The program just requires users to upload data, and it generates a pretty JPG with charts, graphs, and icons -- no PhotoShop skills required. Given the service's ease and availability -- it's free to join -- it will probably mean the proliferation of more infographics. The definition of what an infographic is can be pretty broad. (Wikipedia's history of the form starts out with cave paintings.) But it's pretty clear to us that there are two crucial parts: information and graphics. Www.readmeresources.co.uk/pdfs/GraphicsInMe/GraphicsInMeLessonOne.pdf.
How to print large infographics. By admin on Monday, March 7th, 2011 | 1 Comment Let’s pretend you’re either not rich, or don’t feel like spending a ton of money.

Who knows, maybe you’re scared of leaving your home, but still want to print this insanely cool infographic you found online. Happened to me today. Then I googled “how to print large infographic”. With this new algo, i’m kinda not suprised the machine isn’t learning well. The thing’s called rasterbator, and claims it will let you print wall size pics if you need.
The graphic I found online today was a complete visual of most marketing strategies online, but it was way too big to get a good view of from on it’s own. Here’s a pic of Raseterbator in action: 10 Awesome Free Tools To Make Infographics. Advertisement Who can resist a colourful, thoughtful venn diagram anyway?

In terms of blogging success, infographics are far more likely to be shared than your average blog post. This means more eyeballs on your important information, more people rallying for your cause, more backlinks and more visits to your blog. In short, a quality infographic done well could be what your blog needs right now. Designing An Infographic Some great tips for designing infographics: Keep it simple! Ideas for infographic formats include: Timelines;Flow charts;Annotated maps;Graphs;Venn diagrams;Size comparisons;Showing familiar objects or similar size or value. Here are some great tutorials on infographic creation: Designing Quality Infographics: Tips, Resources and Inspiration. Infographics are graphic visual representations of data and information.

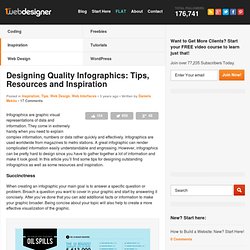
They come in extremely handy when you need to explain complex information, numbers or data rather quickly and effectively. Infographics are used worldwide from magazines to metro stations. A great infographic can render complicated information easily understandable and engrossing. However, infographics can be pretty hard to design since you have to gather together a lot of information and make it look good. In this article you’ll find some tips for designing outstanding infographics as well as some resources and inspiration.
Succinctness When creating an infographic your main goal is to answer a specific question or problem. The World’s Most Disastrous Oil Spills is the title for an infographic created by Travel Insurance. Creativity Ingenuity and design is what separates an infographic from the simple charts you see elsewhere. Visualization. 5 Unbeatable Types of Infographic + Free Tools to Create Them. An infographic (information graphic) has been a very effective way to bait for links and social media votes for ages.

Like anything else, it can be done right or wrong (I am sure you have seen dozens of poorly implemented infographics by now and maybe a few really good ones). How to create a good one? The secret is in days (maybe months) of brainstorming. A cool concept doesn’t even have to be too very well-designed. All you need is a great idea and some time of putting it together. This post lists 5 unbeatable (when done right) types of infographics as well as free tools to help you put your ideas to life – enjoy!
1. As the periodic table hangs in thousands of classrooms all over the world, it has become a visual metaphor and serves now as a template for knowledge presentation in various niches and verticals. Examples: How To Create Outstanding Modern Infographics. In this tutorial you will learn that data doesn't have to be boring, it can be beautiful!

Learn how to use various graph tools, illustration techniques and typography to make an accurate and inspiring infographic in Adobe Illustrator. Start by using the Rectangle Tool (M) to draw a shape. Give it a subtle radial gradient too. The entire design is based on a grid of four columns. To make the columns first select the rectangle and drag a guide onto the centre of the shape. Condense the shape so it fits within the left-most guide and centre guide. Move the shape over to the right and add another guide to the centre here. Using the Rectangle Tool (M) draw a thin white box on the centre line that will be the width of the gap between the columns. Repeat the process for the other columns with your final result being below. I like to place the most important graphics first and work-in the ancillary charts and graphs afterwards.