
Httr quickstart guide. The goal of this document is to get you up and running with httr as quickly as possible. httr is designed to map closely to the underlying http protocol.
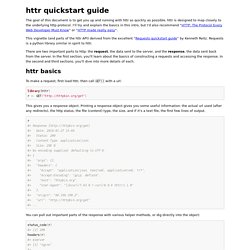
I'll try and explain the basics in this intro, but I'd also recommend “HTTP: The Protocol Every Web Developer Must Know” or “HTTP made really easy”. This vignette (and parts of the httr API) derived from the excellent “Requests quickstart guide” by Kenneth Reitz. Requests is a python library similar in spirit to httr. There are two important parts to http: the request, the data sent to the server, and the response, the data sent back from the server. In the first section, you'll learn about the basics of constructing a requests and accessing the response. Introducing dplyr. Dplyr is a new package which provides a set of tools for efficiently manipulating datasets in R. dplyr is the next iteration of plyr, focussing on only data frames. dplyr is faster, has a more consistent API and should be easier to use.
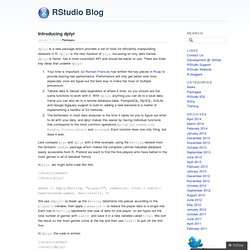
There are three key ideas that underlie dplyr: Your time is important, so Romain Francois has written the key pieces in Rcpp to provide blazing fast performance. Introduction to dplyr. Databases. As well as working with local in-memory data like data frames and data tables, dplyr also works with remote on-disk data stored in databases.
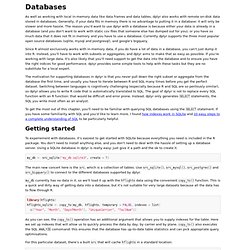
Generally, if your data fits in memory there is no advantage to putting it in a database: it will only be slower and more hassle. The reason you'd want to use dplyr with a database is because either your data is already in a database (and you don't want to work with static csv files that someone else has dumped out for you), or you have so much data that it does not fit in memory and you have to use a database. Currently dplyr supports the three most popular open source databases (sqlite, mysql and postgresql), and google's bigquery.
Since R almost exclusively works with in-memory data, if you do have a lot of data in a database, you can't just dump it into R. Instead, you'll have to work with subsets or aggregates, and dplyr aims to make that as easy as possible. Getting started. Rcpp: Seamless R and C++ Integration. Package ProjectTemplate. Package HiveR. Making a hive plot of HIV transmission network — tutorial. Hiveplots are the über-cool graph visualization created by the prolific Martin Krzywinski and ported to R by the equally talented Bryan Hanson.

Martin has created a network visualization tool which displays the underlying structure of a network and ends the hairball syndrome. Enough hype. Let's get started. The fundamental step is to think about what characterizes your network. Each node will lie on an axis and have a distance from the center point. I am looking at patterns of HIV transmission. One question of interest is links between different transmission groups. Now the hard part is over, and the coding begins. The visible edges in the full transmission network The first plot of the graph was confusing in that within group and between group transmissions were obscured by the total number of edges. This brings out another issue. Gastonstat/arcdiagram. Arc Diagrams in R: Les Miserables. Posted on 02 Feb 2013 In this post we will talk about the R package "arcdiagram" for plotting pretty arc diagrams like the one below: Arc Diagrams An arc diagram is a graphical display to visualize graphs or networks in a one-dimensional layout.
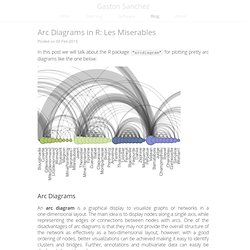
The main idea is to display nodes along a single axis, while representing the edges or connections between nodes with arcs. One of the disadvantages of arc diagrams is that they may not provide the overall structure of the network as effectively as a two-dimensional layout; however, with a good ordering of nodes, better visualizations can be achieved making it easy to identify clusters and bridges. Rob J Hyndman - forecast package for R. ARIMA Modelling of Time Series. Description Fit an ARIMA model to a univariate time series.
Usage arima(x, order = c(0L, 0L, 0L), seasonal = list(order = c(0L, 0L, 0L), period = NA), xreg = NULL, include.mean = TRUE, transform.pars = TRUE, fixed = NULL, init = NULL, method = c("CSS-ML", "ML", "CSS"), n.cond, SSinit = c("Gardner1980", "Rossignol2011"), optim.method = "BFGS", optim.control = list(), kappa = 1e6) Arguments Details Different definitions of ARMA models have different signs for the AR and/or MA coefficients.
Exegetic Analytics. According to Wikipedia, an iterator is “an object that enables a programmer to traverse a container”.

A collection of items (stashed in a container) can be thought of as being “iterable” if there is a logical progression from one element to the next (so a list is iterable, while a set is not). An iterator is then an object for moving through the container, one item at a time. Iterators are a fundamental part of contemporary Python programming, where they form the basis for loops, list comprehensions and generator expressions. Iterators facilitate navigation of container classes in the C++ Standard Template Library (STL). They are also to be found in C#, Java, Scala, Matlab, PHP and Ruby. Although iterators are not part of the native R language, they are implemented in the iterators and itertools packages.
The iterators package is written and maintained by Revolution Analytics. Byte Code Compiler. Description These functions provide an interface to a byte code compiler for R.
Usage cmpfun(f, options = NULL) compile(e, env = .GlobalEnv, options = NULL) cmpfile(infile, outfile, ascii = FALSE, env = .GlobalEnv, verbose = FALSE, options = NULL) loadcmp(file, envir = .GlobalEnv, chdir = FALSE) disassemble(code) enableJIT(level) compilePKGS(enable) getCompilerOption(name, options) setCompilerOptions(...) Arguments Details The function cmpfun compiles the body of a closure and returns a new closure with the same formals and the body replaced by the compiled body expression. compile compiles an expression into a byte code object; the object can then be evaluated with eval. cmpfile parses the expression in infile, compiles them, and writes the compiled expressions to outfile.
Loadcmp is used to load compiled files. Disassemble produces a printed representation of the code that may be useful to give a hint of what is going on. enableJIT enables or disables just-in-time (JIT) compilation.