
Bolshoi Simulation. Cover feature and podcast: Sky & Telescope, July 2012 [Listen to the podcast] [vew a PDF of this article] The full version of the article as published in the July 2012 issue of Sky & Telescope is reprinted with the permission of the magazine.
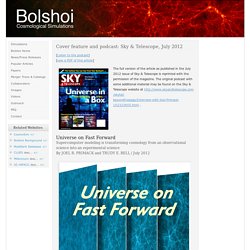
The original podcast with some additional material may be found on the Sky & Telescope website at beyondthepage/Interview-with-Joel-Primack-152323655.html . Universe on Fast Forward Supercomputer modeling is transforming cosmology from an observational science into an experimental science By JOEL R. PRIMACK and TRUDY E. Sources: STEFAN GOTTLÖBER / LEIBNIZ-INSTITUT FÜR ASTROPHYSIK POTSDAM EVOLVING UNIVERSE left to right: These frames from the Bolshoi simulation depict the universe at redshifts of 10, 3, 1, and 0, which correspond to cosmic ages of 490 million years, 2.2 billion years, 6 billion years, and 13.7 billion years (today). The computational power of supercomputers is literally transforming cosmology into an experimental science.
Sources: N. Untitled. Untitled. Untitled. Untitled. Untitled. Eaa strucformsims.
SkyView Virtual Observatory. Simulation projet recherche. Millennium Simulation Project. Introduction: The Millennium Simulation The Millennium Run used more than 10 billion particles to trace the evolution of the matter distribution in a cubic region of the Universe over 2 billion light-years on a side.
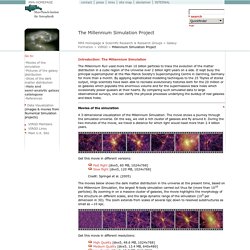
It kept busy the principal supercomputer at the Max Planck Society's Supercomputing Centre in Garching, Germany for more than a month. By applying sophisticated modelling techniques to the 25 Tbytes of stored output, Virgo scientists have been able to recreate evolutionary histories both for the 20 million or so galaxies which populate this enormous volume and for the supermassive black holes which occasionally power quasars at their hearts. By comparing such simulated data to large observational surveys, one can clarify the physical processes underlying the buildup of real galaxies and black holes. Movies of the simulation A 3-dimensional visualization of the Millennium Simulation.
Get this movie in different versions: Get this movie in different resolutions: References. SCOPE: Cosmus [Projects:Cosmus' Sloan Galaxies Visualization] The Sloan Digital Sky Survey is a huge and important project to map, in a quarter of the sky, as much of universe as is visible from earth.
![SCOPE: Cosmus [Projects:Cosmus' Sloan Galaxies Visualization]](http://cdn.pearltrees.com/s/pic/th/projects-visualization-4363249)
The SDSS releases data periodically, and will hopefully be complete in a few more years. Download: sdss4wmap.zip (for Windows and Linux) sdss4wmap_mac.tar.gz (for Macs) : 440 000 galaxies (375 000 main sequence, 65 000 large red galaxies) and 70 000 quasars from SDSS Data Release 4, plus the cosmic microwave background as measured by the NASA/WMAP science team. Size: 55 Mb. You can find the movie made with this on the Cosmus movie page or on Google Video.
Made in October 2005. [Caution: not many machines can handle this data set, so try the DR3 version - below - first.] Download: sdss3wmap.zip 300 000 galaxies and 49 000 quasars from SDSS Release 3, plus the cosmic microwave background. Mark Subbarao, Dinoj Surendran, and Randy Landsberg have made a 3d model of the galaxies and quasars found by the SDSS. Uses made of this visual so far: Sloan Digital Sky Survey. Kim Albrecht on Untangling Tennis and the Cosmic Web – Data Stories. Kim is a visualization researcher and information designer.

He currently works at the Center for Complex Network Research, the lab led by famous network physicist László Barabási. Kim works in a team of scientists to create effective and beautiful visualizations that explain complex scientific phenomena. In the show we focus on Untangling Tennis, a data visualization project aimed at explaining the relationship between popularity and athletic performance. We also talk about his more recent project, the Cosmic Web, which visualizes 24,000 galaxies and their network of gravitational relationships. Enjoy the show! This episode of Data Stories is sponsored by Qlik, which allows you to explore the hidden relationships within your data that lead to meaningful insights. Kim is a visualization researcher and information designer. In the show we focus on Untangling Tennis, a data visualization project aimed at explaining the relationship between popularity and athletic performance. DEUS consortium – Dark Energy Universe Simulations.
SDSS SkyServer DR12. The animation to the right shows schematically what the expanding universe looks like.
Each galaxy, represented by a white dot, is getting farther away from every other galaxy. (You saw the same effect with dots on the balloon.) If the universe is expanding today, as the animation shows, then at some point in the past it must have been smaller. If you go far enough back in time - if you rewind the animation far enough - then at some point the universe must have had zero size and started expanding.
Astronomers call the start of expansion the "big bang. " The "big bang" was not an explosion - it was just the time when the universe started expanding. What you measured in this project was relative, not absolute, distance. Measuring absolute distances in astronomy is extremely difficult, but you can use the equation c z = H0 d to estimate the distance to a distant galaxy from its redshift. Simul 3D Univers - IRFU CEA.