
34 Outstanding Admin Panels for Your Web Applications. Nowadays, more and more web applications are trying to take their stake from the internet, coming in your help and trying to make your internet`s life easier through their admin panels.

Many people are using today twitter and facebook,or other social networks to communicate,and as a reward,big networks are offering what is called “The API key” (application programming interface) to help programmers to create related web applications. Now,is so simple to create a web app,there are many tutorials showing you how to use the key;all you have to do is to come with an out of the box idea.So,you have the application.What`s next? I`m saying an “Administration Panel” and you must agree my point of view because is a must-have for a web app.So,I want to come in your help and presenting you 34 most appealing and fully featured back-end control admin panels from the internet.
Choose you favourite,create an web app and start taking your internet stake too!
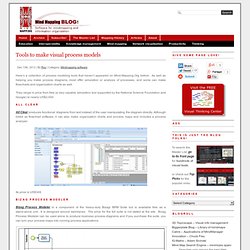
Data Visualization. Data Visualization. Jquery infographics. Tree Visualization. Visualización. Data and visualization. Tools to make visual process models. Here’s a collection of process modeling tools that haven’t appeared on Mind-Mapping.Org before.

As well as helping you make process diagrams, most offer simulation or analysis of processes, and some can make flowcharts and organization charts as well. They range in price from free (a very capable simulation tool supported by the National Science Foundation and Google) to nearly US$2,000. All Clear All Clear produces functional diagrams from text instead of the user manipulating the diagram directly. Although billed as flowchart software, it can also make organization charts and process maps and includes a process analyzer. Its price is US$349. Bizag Process Modeler Bizag Process Modeler is a component of the heavy-duty Bizagi BPM Suite but is available free as a stand-alone unit.
Click for full-size image The BPM Suite is an enterprise product that supports business rules, forms designer, workflow, work portal, and analytics. Insight Maker iThink Its price is US$1,899. Synthis Process Modeler. Package treemap. Interactive information visualization toolkit. D3.js - Data-Driven Documents. 20 superb data visualisation tools for web designers. It's often said that data is the new world currency, and the web is the exchange bureau through which it's traded.

As consumers, we're positively swimming in data; it's everywhere from labels on food packaging design to World Health Organisation reports. As a result, for the designer it's becoming increasingly difficult to present data in a way that stands out from the mass of competing data streams. Get Adobe Creative Cloud One of the best ways to get your message across is to use a visualization to quickly draw attention to the key messages, and by presenting data visually it's also possible to uncover surprising patterns and observations that wouldn't be apparent from looking at stats alone. And nowadays, there's plenty of free graphic design software to help you do just that. As author, data journalist and information designer David McCandless said in his TED talk: "By visualizing information, we turn it into a landscape that you can explore with your eyes, a sort of information map.
Profnayla. Moovly - Create Animated Content like a Pro. PowToon, free business presentation software animated video maker and PowerPoint alternative. Metta — Storytelling + Polling In One Compact Format. Memofon. Welshjs. Visualización de Datos, Infografía y Estadísticas. Hayat. 13 Chart and Graph plotting javascript plugins. There are more and more Javascript chart and graph plotting solutions are being released and available for free online.

I work on a complicated graph for a website before, we used highchart as the solution, during that time, there isn't a lot of plugins to choose from, but now, we can easily find many very capable charting libraries. Personally, the rise of this kind of plugins are due to: Flash used to be the best solution, but everyone is moving on from there.Modern browsers and powerful computing make it possible to render live data easily.Maturity of different technologies in drawing vector: VML, SVG and Canvas.
Of course, you need to carefully choose one that fit your requirements. As we mentioned before, they use various technologies, as a result, some plugins support canvas only which require modern browsers, and other combine multiple technologies altogether so it able to work on different platforms and older browsers. Javascript Graphs and Charts libraries. Flot: Attractive JavaScript plotting for jQuery. Doc et théorie. Data visualization.