
Tufte in R. Randy Olson sur Twitter : "What 12 Months Of Record-Setting Temperatures Looks Like Across The U.S. #dataviz. What 12 Months Of Record-Setting Temperatures Looks Like Across The U.S. If this year feels hotter than normal, it’s not just you.
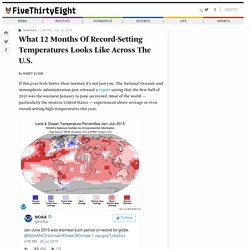
The National Oceanic and Atmospheric Administration just released a report saying that the first half of 2015 was the warmest January to June on record. Most of the world — particularly the western United States — experienced above-average or even record-setting high temperatures this year. In fact, the 12-month period from July 2014 through June 2015 was the warmest ever recorded. I was curious to see what these record-setting temperatures looked like in more detail, so I updated a famous New York Times weather chart to show the past 12 months of temperatures for a handful of large cities across the U.S. These charts show the record, average high and low (“normal range”), and actual temperatures over the past year for each day in each city. Each city has a unique story to tell. Los Angeles — famous for its year-round just-right temperatures — experienced several heat waves this year. Alberto Cairo sur Twitter : "Nine Charts about Wealth Inequality in America @urbaninstitute #dataviz via @flowingdata.
Nine Charts about Wealth Inequality in America. Median wealth by race and ethnicity is lower than average wealth, but the trends stay the same.
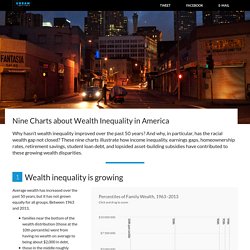
Both measures are important because average wealth indicates how a group is prospering as a whole relative to other groups, while median wealth shows how the “typical” family is doing. Sources: Survey of Financial Characteristics of Consumers 1962 (December 31), Survey of Changes in Family Finances 1963, and Survey of Consumer Finances 1983–2013. Notes: 2013 dollars.
Yale Climate Opinion Maps. Place I Live sur Twitter : "This is how gentrification has reshaped neighborhoods in #NewYork: #dataviz. New York City Gentrification Maps and Data. To assess how gentrification has reshaped urban neighborhoods, Governing analyzed demographic data for the nation’s 50 most populous cities.
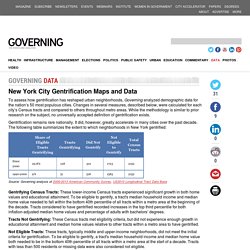
Changes in several measures, described below, were calculated for each city’s Census tracts and compared to others throughout metro areas. While the methodology is similar to prior research on the subject, no universally accepted definition of gentrification exists. Gentrification remains rare nationally. It did, however, greatly accelerate in many cities over the past decade. Randal_olson : How Americans Feel About ... How Americans Feel About Religious Groups. Jews, Catholics and evangelical Christians are viewed warmly by the American public.
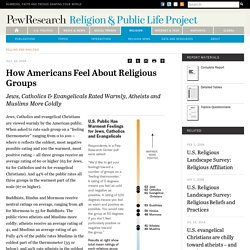
When asked to rate each group on a “feeling thermometer” ranging from 0 to 100 – where 0 reflects the coldest, most negative possible rating and 100 the warmest, most positive rating – all three groups receive an average rating of 60 or higher (63 for Jews, 62 for Catholics and 61 for evangelical Christians). And 44% of the public rates all three groups in the warmest part of the scale (67 or higher). Buddhists, Hindus and Mormons receive neutral ratings on average, ranging from 48 for Mormons to 53 for Buddhists. The public views atheists and Muslims more coldly; atheists receive an average rating of 41, and Muslims an average rating of 40.
Fully 41% of the public rates Muslims in the coldest part of the thermometer (33 or below), and 40% rate atheists in the coldest part. Groups Tend To Be Rated Most Positively by Their Own Members Politics and Religion: Partisans’ Views of Religious Groups. Text Analytics Is Hard (That’s What She Said) You think math is hard?
Hah. At least in math, there is a clearly defined right answer, unless you’re talking statistics, and even there we have well-defined methods and accepted ways of doing things. If you like an analytics challenge, try taking on one of the more complex text analytics tasks – sentiment analysis, perhaps, or propensity modeling. The subtleties of human language make automated text analysis a mighty tall order. Full-Text RSS Feeds. Documentation and support Our help site covers most of what you'll need to know to get Full-Text RSS up and running and customised to work the way you want.

Our public forum is the place to ask questions and browse previous answers. Treemap of Top 1 Percent Occupations « visualign. On Jan 15, 2012 the New York Times published an interactive Treemap graphic with the title: “The Top 1 Percent: What Jobs Do They Have?” Extend, visualize and share data online. Bust your data out of its silo!

Get more from data with Fusion Tables. Fusion Tables is an experimental data visualization web application to gather, visualize, and share data tables. Visualize bigger table data online Filter and summarize across hundreds of thousands of rows. Then try a chart, map, network graph, or custom layout and embed or share it.
Text Mining to Word Cloud App with R. My Data-Driven Philosophy « Michelle Minkoff. Talk to me about journalism for a few minutes, and I’ll pull out the phrase “the mission”.

To me, that means constantly teaching and learning, in order to tell more engaging and understandable stories about our world, where people can manipulate information as they see fit. The learning/teaching applies to the content itself, and passing that content to our customers/users/whatever you want to call “the people” AS WELL as the technology, and staying on top of innovative and better ways to tell our stories, while avoiding the fear that certain things are “too hard” or “beyond our grasp.” On launching BIG projects — and gaining confidence « Michelle Minkoff. Wow, another post where I point out that I haven’t written for months.

A lot has been accomplished. I wanted a job where I learned. DONE.