
Comprendre l’analyse de la variance (ANOVA) et le test F. L’analyse de la variance (ANOVA) peut déterminer si les moyennes de trois groupes ou plus sont différentes.

ANOVA utilise des tests F pour tester statistiquement l’égalité des moyennes. Dans cet article, nous allons vous montrer comment ANOVA et les tests F fonctionnent en utilisant un exemple d’une ANOVA à un facteur contrôlé. Mais attendez une minute... avez-vous déjà cessé de vous demander pourquoi vous utilisez une analyse de Variance pour déterminer si les moyennes sont différentes ? Analysons comment les écart-types fournissent des informations sur les moyennes. Comme dans un article précédent sur la compréhension des tests t, nous allons nous concentrer sur les concepts et les graphiques plutôt que les équations, pour expliquer les tests F de l’ANOVA. Naive Bayes Algorithm: A Complete guide for Data Science Enthusiasts. This article was published as a part of the Data Science Blogathon In this article, we will discuss the mathematical intuition behind Naive Bayes Classifiers, an also see how to implement this on Python.
This model is easy to build and is mostly used for large datasets. Pandas: un exemple très simple de DataFrame.rolling () Pendant que je lisais ici, une fonction appelée rolling () est soudainement sortie.
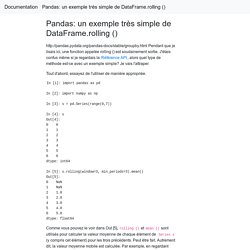
J'étais confus même si je regardais la Référence API, alors quel type de méthode est-ce avec un exemple simple? Je vais l'attraper. Tout d'abord, essayez de l'utiliser de manière appropriée. In [1]: import pandas as pd In [2]: import numpy as np In [3]: s = pd.Series(range(0,7)) In [4]: s Out[4]: 0 0 1 1 2 2 3 3 4 4 5 5 6 6 dtype: int64 In [5]: s.rolling(window=3, min_periods=3).mean() Out[5]: 0 NaN 1 NaN 2 1.0 3 2.0 4 3.0 5 4.0 6 5.0 dtype: float64 Comme vous pouvez le voir dans Out [5], rolling () et mean () sont utilisés pour calculer la valeur moyenne de chaque élément de Series s (y compris cet élément) pour les trois précédents.
Pandas: un exemple très simple de DataFrame.rolling () Analyse de Correlation. P-values Are Tough And S-values Can Help. The -value doesn’t have many fans.

There are those who don’t understand it, often treating it as a measure it’s not, whether that’s a posterior probability, the probability of getting results due to chance alone, or some other bizarre/incorrect interpretation.1–3 Then there are those who dislike it because they think the concept is too difficult to understand or because they see it as a noisy statistic we’re not interested in. However, the groups of people mentioned above aren’t mutually exclusive.
Many who dislike and criticize the -value also do not understand its properties and behavior. Top 10 Statistics Mistakes Made by Data Scientists. A data scientist is a “person who is better at statistics than any software engineer and better at software engineering than any statistician”.
In Top 10 Coding Mistakes Made by Data Scientists we discussed how statisticians can become a better coders. Here we discuss how coders can become better statisticians. Detailed output and code for each of the examples is available in github and in an interactive notebook. Introduction to Statistics for Data Science. CME 106 - Pense-bête de statistiques. Estimation de paramètre Définitions Échantillon aléatoire Un échantillon aléatoire est une collection de n variables aléatoires X1,...,Xn qui sont indépendantes et identiquement distribuées avec X.
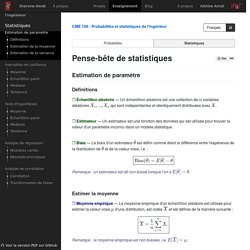
Estimateur Un estimateur est une fonction des données qui est utilisée pour trouver la valeur d'un paramètre inconnu dans un modèle statistique. CME 106 - Pense-bête de probabilités. Introduction aux probabilités et à la combinatoire Univers de probabilités L'ensemble de toutes les issues possibles d'une expérience aléatoire est appelé l'univers de probabilités d'une expérience aléatoire et est noté S.
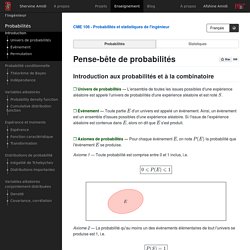
Évènement Toute partie E d'un univers est appelé un évènement. Ainsi, un évènement est un ensemble d'issues possibles d'une expérience aléatoire. Si l'issue de l'expérience aléatoire est contenue dans E, alors on dit que E s'est produit. Axiomes de probabilités Pour chaque évènement E, on note P(E) la probabilité que l'évènement E se produise. Statistics & Data Science. Essence of linear algebra, chapter 1. Publications. Making the Most of Regression (or: Regression is Story-telling and Here’s How to Tell Your Story Well) If_not_install <- function(packages) { new_pack <- packages[!
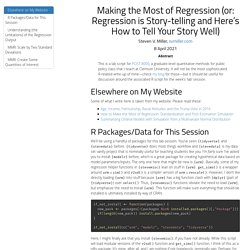
(packages %in% installed.packages()[,"Package"])] if(length(new_pack)) install.packages(new_pack)}if_not_install(c("arm", "modelr", "stevedata", "tidyverse")) Here, I might finally ask that you install {stevemisc}, if you have not already. While this script will load modular versions of the r2sd() function and get_sims() function, I think of this as a nifty package. It’s mine, after all, and I am nothing if not hopelessly, terminally vain.
Towardsdatascience. The general statistical rule is that whenever the correlation between two variables is imperfect (i.e. in the graph above, the slope is not 1), there will be regression to the mean.
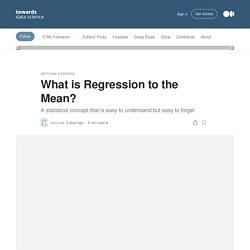
But… so what? Regression to the mean is a statistical fact about the world that is both easy to understand and easy to forget. What is Regression? Learn Basic statistics for Business Analytics. Towardsdatascience. The initial dataset has been used for a Kaggle Challenge where teams were competing to design the best model to predict sales.
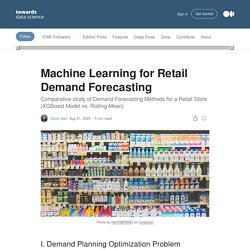
The first objective here is to design a prediction model using XGBoost; this model will be used to optimize our replenishment strategy ensuring inventory optimization and reducing the number of deliveries from your Warehouse. 1. Add Date Features 2. * Statistique et probabilités - Niveau 2. 29 Statistical Concepts Explained in Simple English - Part 1.