
Create and share visual ideas online. 20+ Tools to Create Your Own Infographics. A picture is worth a thousand words – based on this, infographics would carry hundreds of thousands of words, yet if you let a reader choose between a full-length 1000-word article and an infographic that needs a few scroll-downs, they’d probably prefer absorbing information straight from the infographic. What’s not to like? Colored charts and illustrations deliver connections better than tables and figures and as users spend time looking back and forth the full infographic, they stay on the site longer. Plus, readers who like what they see are more likely to share visual guides more than articles. While not everyone can make infographics from scratch, there are tools available on the Web that will help you create your very own infographics.
In this article, we’re listing more than 20 such options to help you get your messages across to your readers, visually. Read Also: The Infographic Revolution: Where Do We Go From Here? What About Me? “What About Me?” Vizualize.me Piktochart easel.ly. Piktochart: Infographic and Presentation Tool for Non-Designers. How to Create an Effective Infographic. This post was written by Scott Schwertly Scott is the Founder and CEO of Ethos3.
Infographics have quite suddenly become all the rage in the design world. So suddenly, in fact, that ‘infographic’ isn’t even an official word in the dictionary (little red squiggly lines will annoyingly stain this document throughout its creation). An infographic (officially deemed an informational graphic) should express one idea very well allowing readers to quickly digest and understand complicated information. As a presenter, it’s a good idea to become well versed in this relatively new craze that is most likely here to stay. Tell a Story We should get one thing straight right off the bat. Make sure that the design of your infographic reveals something about the topic at hand. Simplicity Reigns Supreme As always in the world of presentations, simplicity is king.
Avoid using legends or keys. Start Making Sense Also, be as transparent as possible. Many Eyes. Create A Graph. Themes For A Good Infographic. Chronology of NASA Missions by Carlos Gámez from Lainformacion Information graphics give us new ways to understand and think about information.
They include a huge category of visuals that are capable of communicating in diverse ways through charts, maps, diagrams, data visualizations and technical, instructional and scientific explanations. It seems that infographics become more valuable as our need to understand a complex world increases. Recently, I spent a good part of a week sorting through and judging infographics that were submitted to the Malofiej 18, a competition and world summit for visual journalists and infographic artists held in Pamplona, Spain every year. There, I saw consistent design themes that made certain visuals stand out because they were comprehensible and compelling. Here’s a summary of what I think makes an infographic effective. It provides a new way of seeing and thinking The information tells a story The information is well-organized It works on multiple levels.
10 Tips for Designing Infographics. Assuming you’re not working for a media corporation with huge graphics and statistics departments at your disposal, you may want to create some infographics for your own articles.
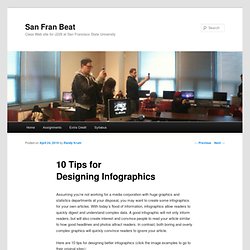
With today’s flood of information, infographics allow readers to quickly digest and understand complex data. A good infographic will not only inform readers, but will also create interest and convince people to read your article similar to how good headlines and photos attract readers. In contrast, both boring and overly complex graphics will quickly convince readers to ignore your article. Here are 10 tips for designing better infographics (click the image examples to go to their original sites): 1) Be Concise: Design your infographic to convey one idea really well. This example is an infographic poster I created about the caffeine content in drinks. The Caffeine Poster, by Randy Krum 2) Be Visual: Design your infographic with your final for viewing size in mind. Google PageRank Explained, by Elliance. A Periodic Table of Visualization Methods. Gapminder: Unveiling the beauty of statistics for a fact based world view.
Data Visualization, Information Design and Infographics. Data Visualization Blog The Excel Charts Blog. Datavisualization.ch. Infographics & Data Visualization. Information Is Beautiful.