
Word Cloud Generator. How the Word Cloud Generator Works The layout algorithm for positioning words without overlap is available on GitHub under an open source license as d3-cloud. Note that this is the only the layout algorithm and any code for converting text into words and rendering the final output requires additional development.
As word placement can be quite slow for more than a few hundred words, the layout algorithm can be run asynchronously, with a configurable time step size. This makes it possible to animate words as they are placed without stuttering. It is recommended to always use a time step even without animations as it prevents the browser’s event loop from blocking while placing the words.
The D3 Graph Gallery. d3pie. D3-based reusable chart library. d3/d3-request: A convenient alternative to XMLHttpRequest. Javascript - d3.js get JSON from url. D3.js in Action PDF Download Free. Packt.Data.Visualization.With.D3.JS.Cookbook.Oct.2013.ISBN.178216216X. GeoJSON Maps of the globe. Zero Viscosity. Mapping with D3 - Maptime Boston. A friendly introduction Andy Woodruff for Maptime Boston @maptimeBoston | @awoodruff Follow along!
Raja Pradhan – Web & InfoSec Enthusiast. GeoJSONLint - Validate your GeoJSON. Logiciels SIG libres. Les SIG libres et/ou gratuits et WebMapping 1.
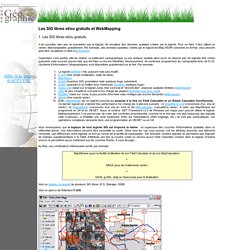
Les SIG libres et/ou gratuits Il est possible, bien que ne possédant pas le logiciel, de visualiser des données spatiales créées par le logiciel. Pour ce faire, il faut utiliser un viewer, téléchargeables gratuitement. Par exemple, des données spatiales créées par le logiciel ArcMap d’ESRI (données en format .shp) peuvent ainsi être visualisées à l’aide d’ArcExplorer. Cependant, il est parfois utile de réaliser un traitement cartographique ou une analyse spatiale alors qu'on ne dispose pas de logiciels SIG certes puissants mais souvent payant (tels que ArcView ou encore Manifold).
Vous remarquerez que la logique de tout logiciel SIG est toujours la même : on superpose des couches d'informations spatiales dans un référentiel donné. Au final, une combinaison intéressante serait, par exemple : Voici un tableau comparatif de plusieurs SIG libres (© S. Voici un apercu de l'interface F-GIS : Voici un aperçu de l'interface OpenJump : 05-Recuperer-Des-Donnees-Geographiques-Libres / Guide du SIG libre. 05 Récupérer des données géographiques libres Projet Espace OpenStreetMap Francophone v1.0, 18/12/2014 Publié sous licence Creative Commons Attribution-ShareAlike 3.0 Unported License Paternité (BY) - Partage des Conditions Initiales à l'Identique (SA) Si la création de données dans OpenStreetMap est aisée au moyen des différents éditeurs et interfaces de contribution, la récupération de données OSM dans d’autres formats de fichiers géographiques a longtemps été un processus relativement complexe, limitant la réutilisation au-delà du cercle des géomaticiens chevronnés.
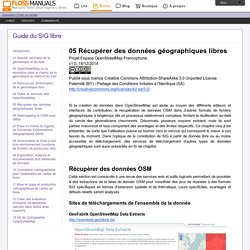
Cette section est consacrée à une revue des services web et outils logiciels permettant de procéder à des extractions de la base de donnés OSM pour constituer des jeux de données à des formats SIG spécifiques en termes d'extension spatiale et de thématique. Sites de téléchargements de l'ensemble de la donnée GeoFabrik OpenStreetMap Data Extracts. Wt2015_d3_js.
Wt2015_d3_js. Data-Driven Documents, Defined. By Scott Murray, author of Interactive Data Visualization for the Web and Assistant Professor of Design at the University of San Francisco.
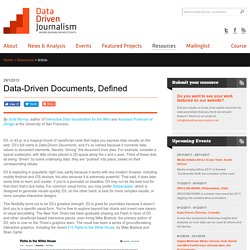
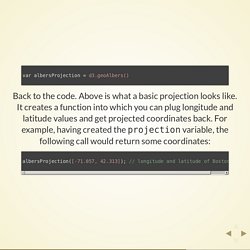
D3, or d3.js, is a magical chunk of JavaScript code that helps you express data visually on the web. D3’s full name is Data-Driven Documents, and it’s so named because it connects data values to document elements, thereby “driving” the document from data. For example, consider a typical scatterplot, with little circles placed in 2D space along the x and y axes.
Think of these dots as being “driven” by some underlying data: they are “pushed” into place, based on their corresponding values. D3 is exploding in popularity right now, partly because it works with any modern browser, including mobile Android and iOS devices, but also because it is extremely powerful. This flexibility turns out to be D3’s greatest strength. In this brief tutorial, I’d like to introduce how to make a very simple visualization with D3. Making a Dot Chart Aha, dots! Perfect! D3.js 4 documentation. HomepageSource code D3 4.0 is a collection of modules that are designed to work together; you can use the modules independently, or you can use them together as part of the default build.
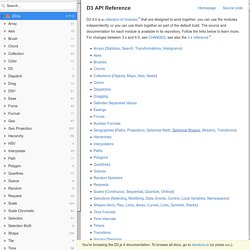
The source and documentation for each module is available in its repository. Follow the links below to learn more. D3plus Examples. D3.js - Data-Driven Documents. Explore D3.js - Data Visualization with D3.js. D3.js - Getting Started. Download D3JS-Intro.zip - 1.7 MB Overview Data visualization is a important part of any software application.
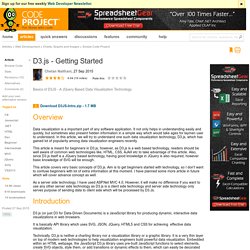
It not only helps in understanding easily and quickly, but sometimes also present hidden information in a simple way which would take ages for laymen user to understand. In this article, we will try to understand one such data visualization technology, D3.js, which has gained lot of popularity among data visualization engineers recently. This article is meant for beginners in D3.js, however, as D3.js is a web based technology, readers should be well aware of common web technologies like, HTML, CSS, AJAX etc to take advantage of this article.
Creating Simple Line and Bar Charts Using D3.js. In a previous article, we learned how to implement bubble charts using D3.js, a JavaScript library for creating data-driven documents.
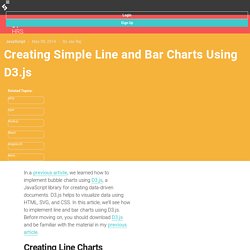
D3.js helps to visualize data using HTML, SVG, and CSS. In this article, we’ll see how to implement line and bar charts using D3.js. Before moving on, you should download D3.js and be familiar with the material in my previous article. Creating Line Charts First, we’ll need some data to plot. We’re also going to need a <svg> element to plot our graph on. Next, we need to create our x and y axes, and for that we’ll need to declare a domain and range.
d3/d3-request: A convenient alternative to XMLHttpRequest.