
The Absolutely True Adventures of a School Librarian: Shared On Social Media: End of Year Reports. While surfing social media sites I come across great posts with equally insightful comments.
Unfortunately, trying to locate these posts in the stream months later is often an impossible task. Thus, in lieu of waiting for the original poster to blog their thoughts, I am starting a series here entitled "Shared On Social Media" so that I can find the information I found useful later.
All credit will be given to the original poster and commenters. None of these posts are my original thoughts. Posted to the Future Ready Librarians Facebook Group on June 9, 2017 by Brad Malone. How to Fix the 15 Most Common Infographic Design Mistakes. Infographic design is no different than any other type of visual content design. It’s not just there to make things look pretty; it’s there to help tell the story.
According to MIT, the brain can process visual information in as little as 13 milliseconds, which is why infographics are such an effective tool—if done well. Infographic design plays a huge role in how you communicate your story, but too often we see design that does a disservice to the content. Whether it’s too cluttered or too confusing, bad design is one of the biggest threats to your infographic’s success. 6 Ways to Get the Bullshit Out of Your Data Visualization. Good data storytelling can do wonders.
It helps you find interesting insights. It helps you tell unique stories that people want to hear. And with beautiful data visualization, you can deliver that story, no matter how complex, in an easy-to-digest package. New HOW TO PICK THE BEST DATA VISUALIZATION FORMAT FOR YOUR STORY. How to Pick the Best Data Visualization Format For Your Story “If you want to tell a powerful story, data is the way to go.
Whether it’s proprietary data, industry research, or public data, there are compelling stories all around. But even the best data story can lose impact if it isn’t presented the right way. That’s why it’s so important to choose the right data visualization format for your data. We find that there is a lot of misinformation or misunderstanding around this topic. How to Pick the Best Data Visualization Format For Your Story. If you want to tell a powerful story, data is the way to go. Whether it’s proprietary data, industry research, or public data, there are compelling stories all around. But even the best data story can lose impact if it isn’t presented the right way. That’s why it’s so important to choose the right data visualization format for your data. Why Your Annual Report Should Be a Piece of Master Storytelling. The annual report is a once-a-year piece of content that’s mandatory for many organizations and a powerful tool for many more.
While it can be tedious to assemble, it’s incredibly important. This single piece of communication presents a wealth of information about your organization to many different audiences. The BSMS Libratory Year in Review: 2015 - 2016 - Bunhead With Duct Tape: Making Learning Stick. Mrs. ReaderPants: Top 25 checkouts for 2015-2016.
School Library Annual Reports. Measure the Future. School Library Annual Reports: Connecting the Dots Between Your Library And Student Learning. My last principal used to call May "the month of mayhem.
" And for good reason. In the northern hemisphere anyway, May means warmer weather, antsy students (and teachers), testing, testing (and more testing), and a rapidly approaching end to yet another school year. Annual Report Kachel. EBSCOhost Login. Infographic: Monthly Library Report. “Hello.
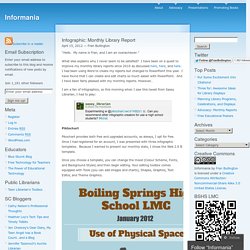
My name is Fran, and I am an overachiever.” What else explains why I never seem to be satisfied? I have been on a quest to improve my monthly library reports since 2010 as discussed here, here, and here. I had been using Word to create my reports but changed to PowerPoint this year. Extreme Monthly Library Report Makeover. Since opening my library in August of 2006, I have compiled a monthly report as part of my efforts to share what is happening with the library program and as a tool for reflection and action.
I have always completed paper reports using Microsoft Word and posted them on the library website as Word document or Adobe Acrobat PDF; each year, I have added tweaks and additional data. Last year’s reports (you can see here or here) represented a somewhat dramatic improvement as I incorporated more images, improved graphic design, some additional quantitative data, and a correlation of collaborative lessons (and the accompanying research pathfinders) to assorted standards, including AASL, ISTE, and state performance standards (Georgia Performance Standards or GPS).
EBSCOhost Login.
Reporting tools.