
Arts Graphiques. DONNÉES.
Visualization de données. OUTILS VISUELS. Sites sur la pensée visuelle. Ressources Visuelles Libres de Droit. Diagramme de Venn. Un article de Wikipédia, l'encyclopédie libre.
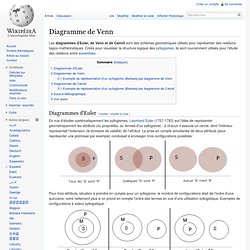
Les diagrammes d'Euler, de Venn et de Carroll sont des schémas géométriques utilisés pour représenter des relations logico-mathématiques. Créés pour visualiser la structure logique des syllogismes, ils sont couramment utilisés pour l'étude des relations entre ensembles. Diagrammes d'Euler[modifier | modifier le code] En vue d'étudier systématiquement les syllogismes, Leonhard Euler (1707-1783) eut l'idée de représenter géométriquement les attributs (ou propriétés, ou termes d'un syllogisme) : à chacun il associa un cercle, dont l'intérieur représentait l'extension (le domaine de validité) de l'attribut.
La prise en compte simultanée de deux attributs (pour représenter une prémisse par exemple) conduisait à envisager trois configurations possibles : Exemples de configurations non syllogistiques : Certaines configurations à quatre attributs (ou plus) ne peuvent pas être représentées par la méthode d'Euler. Voir aussi[modifier | modifier le code] Everyday Venn. I Love Charts. Www.data-art.net/newscloud/swf/news_cloud.html?source=bbc. Gribouilleurs, unissez vous ! Les secrets de la pensée libérée : 27 façons d’utiliser le mindmapping (cartes mentales) Ce billet se propose de vous offrir la traduction d’un fabuleux billet publié sur Bootstrapper intitulé “Secrets of Thinking Outside the Box: 27 Ways Digital Entrepreneurs Can Use Mindmapping“.
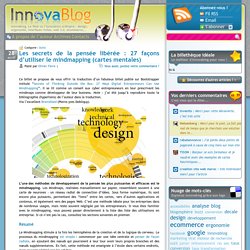
Il se lit comme un conseil aux cyber entrepreuneurs en leur prescrivant les mindmaps comme développeur de leur business. Note : j’ai été jusqu’à reproduire toute la bibliographie (hyperliens) de l’auteur dans la traduction. Via l’excellent Brainsfeed (Pierre-yves Debliquy). L’une des méthodes de développement de la pensée les plus puissantes et efficaces est le mindmapping. Les Mindmaps, réalisées manuellement sur papier, ressemblent souvent à une carte de neurones - un réseau radial de connection d’idées. Résumé Le Mindmapping stimule à la fois les hémisphères de la création et de la logique du cerveau. Mindmapping est parfois appelé « pensée radiante. » (radiant thinking dans le texte). Organisation de l’information. Visual Meetings: How Graphics, Sticky Notes and Idea Mapping Can Transform Group Productivity (9780470601785): David Sibbet.
All you need to know about Visual Thinking. DavidSibbet.com. Strategies for sharing visual information with others. David Sibbett, in his excellent new book, Visual Meetings: How Graphics, Sticky Notes & Idea Mapping Can Transform Group Productivity, shares a number of tips and strategies for sharing key charts, maps and diagrams with meeting participants.
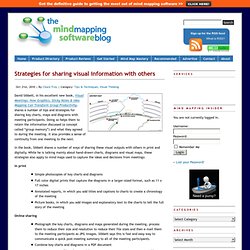
Doing so helps them to retain the information discussed (a concept called “group memory”) and what they agreed to during the meeting. It also provides a sense of continuity from one meeting to the next. In the book, Sibbett shares a number of ways of sharing these visual outputs with others in print and digitally. While he is talking mainly about hand-drawn charts, diagrams and visual maps, these strategies also apply to mind maps used to capture the ideas and decisions from meetings: In print Online sharing Photograph the key charts, diagrams and maps generated during the meeting, process them to reduce their size and resolution to reduce their file sizes and then e-mail them to the meeting participants as JPG images.
Isn’t this a lot of work? 2011 - the year in review. Drafting a new path towards visual free culture. Où est passé la puissance de la “pensée visuelle” Dans le dernier numéro de Wired, l’éditorialiste Clive Thompson évoque la puissance de la pensée visuelle, c’est-à-dire celle qui s’exprime par le dessin plutôt que par les mots.
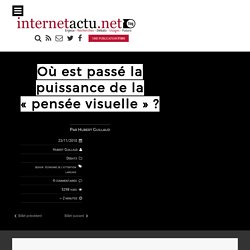
Pour cela, il convoque le dernier livre de Dan Roam (blog), auteur du Retour de la serviette (The Back of the Napkin, évoquant la serviette en papier sur laquelle on griffonne souvent un petit schéma éclairant pendant un repas d’affaires), dans lequel ce dernier montre que notre culture repose trop fortement sur les mots. Nos systèmes scolaires et politiques sont conçus pour promouvoir des gens éloquents dont le mode de pensée est essentiellement verbal.
Notre système de pensée nous encourage à décrire nos problèmes sous forme de récits ou des listes linéaires de fait. Mais les problèmes dynamiques ou compliqués ne peuvent souvent pas se résumer à de simples récits. Ce sont des systèmes composés de nombreuses parties qui s’affectent les unes les autres. Sauf que les outils, à nouveau, ne feront pas tout. Healthcare Napkins All.