
How-To: Get Started. Protovis uses JavaScript.
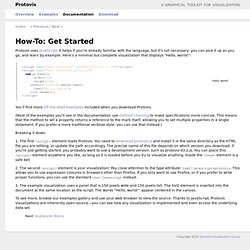
It helps if you’re already familiar with the language, but it's not necessary; you can pick it up as you go, and learn by example. Here's a minimal but complete visualization that displays “Hello, world!” : You’ll find more off-the-shelf examples included when you download Protovis. (Most of the examples you'll see in the documentation use method chaining to make specifications more concise. Choropleth Maps. Examples. Enjoy these sample visualizations built with Protovis.
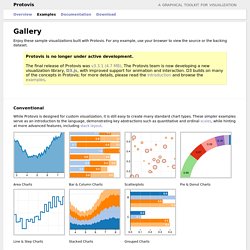
For any example, use your browser to view the source or the backing dataset. Protovis is no longer under active development.The final release of Protovis was v3.3.1 (4.7 MB). The Protovis team is now developing a new visualization library, D3.js, with improved support for animation and interaction. D3 builds on many of the concepts in Protovis; for more details, please read the introduction and browse the examples.
Conventional. Protovis. Protovis composes custom views of data with simple marks such as bars and dots.
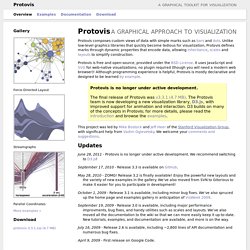
Unlike low-level graphics libraries that quickly become tedious for visualization, Protovis defines marks through dynamic properties that encode data, allowing inheritance, scales and layouts to simplify construction. Protovis is free and open-source, provided under the BSD License. It uses JavaScript and SVG for web-native visualizations; no plugin required (though you will need a modern web browser)! Although programming experience is helpful, Protovis is mostly declarative and designed to be learned by example.