
R Markdown: The Definitive Guide. Note: This book is to be published by Chapman & Hall/CRC.
The online version of this book is free to read here (thanks to Chapman & Hall/CRC), and licensed under the Creative Commons Attribution-NonCommercial-ShareAlike 4.0 International License. The document format “R Markdown” was first introduced in the knitr package (Xie 2015, 2018d) in early 2012. The idea was to embed code chunks (of R or other languages) in Markdown documents. In fact, knitr supported several authoring languages from the beginning in addition to Markdown, including LaTeX, HTML, AsciiDoc, reStructuredText, and Textile. Looking back over the five years, it seems to be fair to say that Markdown has become the most popular document format, which is what we expected.
However, the original version of Markdown invented by John Gruber was often found overly simple and not suitable to write highly technical documents. In a nutshell, R Markdown stands on the shoulders of knitr and Pandoc. R - use csl-file for pdf-output in bookdown. Customizing time and date scales in ggplot2. Using Linear Regression for Predictive Modeling in R. R as learning tool: solving integrals – R-posts.com. Integrals are so easy only math teachers could make them difficult.When I was in high school I really disliked math and, with hindsight, I would say it was just because of the the prehistoric teaching tools (when I saw this video I thought I’m not alone).
I strongly believe that interaction CAUSES learning (I’m using “causes” here on purpose being quite aware of the difference between correlation and causation), practice should come before theory and imagination is not a skill you, as a teacher, could assume in your students. Here follows a short and simple practical explanation of integrals. Git: Delete a branch (local or remote) Reliving my Undergrad Thesis via ggplot2: Part 1. A Complete Tutorial on Tree Based Modeling from Scratch (in R & Python) Programming with dplyr. The following recipes walk you through the basics of tidyeval, with the nominal goal of reducing duplication in dplyr code.
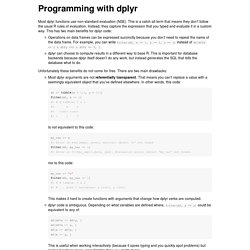
The examples here are somewhat inauthentic because we’ve reduced them down to very simple components to make them easier to understand. They’re so simple that you might wonder why we bother writing a function at all. But it’s a good idea to learn the ideas on simple examples, so that you’re better prepared to apply them to the more complex situations you’ll see in your own code. Exploring the Relationship Between Dog Names and Breeds. How much does breed influence a dog's name?
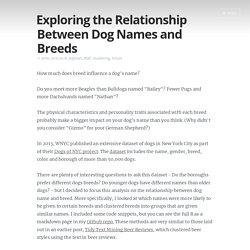
Do you meet more Beagles than Bulldogs named "Bailey"? Fewer Pugs and more Dachshunds named "Nathan"? The physical characteristics and personality traits associated with each breed probably make a bigger impact on your dog's name than you think. (Why didn't you consider "Gizmo" for your German Shepherd?) In 2013, WNYC published an extensive dataset of dogs in New York City as part of their Dogs of NYC project. There are plenty of interesting questions to ask this dataset - Do the boroughs prefer different dogs breeds? What are the most common dog names and breeds? The most common dog breeds in NYC are Yorkshire Terriers and Shih Tzus. Regular Expressions Every R programmer Should Know. Author: Theo Roe Regular expressions.
How they can be cruel! Well we’re here to make them a tad easier. To do so we’re going to make use of the stringr package install.packages("stringr") library("stringr") We’re going to use the str_detect() and str_subset() functions. Pimp my RMD: a few tips for R Markdown – The R Graph Gallery. R markdown creates interactive reports from R code.
I’ve created a document that provides a few tips I use on a daily basis to improve the appearance of my html outputs (my memory aid). This document is built using R Markdown and hosted on Github. You can access it here, and here is a list of the current tips that are displayed: Of course this list is not exhaustive. If you know some tips that should be added, please advise me! Magrittr and wrapr Pipes in R, an Examination. Let’s consider piping in R both using the magrittr package and using the wrapr package. magrittr pipelines The magittr pipe glyph “%>%” is the most popular piping symbol in R.magrittr documentation describes %>% as follow.
Basic piping:x %>% f is equivalent to f(x)x %>% f(y) is equivalent to f(x, y)x %>% f %>% g %>% h is equivalent to h(g(f(x)))The argument placeholderx %>% f(y, .) is equivalent to f(y, x)x %>% f(y, z = .) is equivalent to f(y, z = x)Re-using the placeholder for attributesIt is straight-forward to use the placeholder several times in a right-hand side expression. However, when the placeholder only appears in a nested expressions magrittr will still apply the first-argument rule. Halogenica/beautifulhugo: Theme for the Hugo static website generator. 15 Types of Regression you should know.
Regression techniques are one of the most popular statistical techniques used for predictive modeling and data mining tasks.
On average, analytics professionals know only 2-3 types of regression which are commonly used in real world. They are linear and logistic regression. But the fact is there are more than 10 types of regression algorithms designed for various types of analysis. Each type has its own significance. Every analyst must know which form of regression to use depending on type of data and distribution. Lets take a simple example : Suppose your manager asked you to predict annual sales. In simple words, regression analysis is used to model the relationship between a dependent variable and one or more independent variables.
Data downloads. The files on this page provide a complete snapshot of crime, outcome, and stop and search data, as held by the Home Office at a particular point in history.
You can get the latest archive as soon as it's published each month from data.police.uk/data/archive/latest.zip. These archives were not being generated before December 2013. Creating corporate colour palettes for ggplot2. @drsimonj here to share how I create and reuse corporate color palettes for ggplot2.
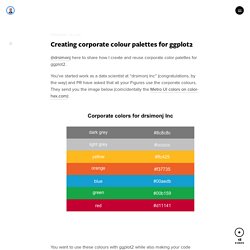
You’ve started work as a data scientist at “drsimonj Inc” (congratulations, by the way) and PR have asked that all your Figures use the corporate colours. They send you the image below (coincidentally the Metro UI colors on color-hex.com): You want to use these colours with ggplot2 while also making your code reusable and flexible.
Outline and setup. Migrating from GitHub to GitLab with RStudio (Tutorial) Edinbr: Text Mining with R. Author: Colin Gillespie During a very quick tour of Edinburgh (and in particular some distilleries), Dave Robinson (Tidytext fame), was able to drop by the Edinburgh R meet-up group to give a very neat talk on tidy text. The first part of the talk set the scene. Theory free tidyeval. I’ve been putting off trying to suss out dplyr’s tidy evaluation for a long time, but I’ve been experimenting a bit with it so just making some notes here. It’s hard to talk about tidy evaluation / Non Standard Evaluation without getting into a whole load of theory, but I’m going to try it anyway, for the sake of other people like myself who don’t use R all the time.
There are people way smarter than me who’ve written great articles on tidy evaluation, see Mara’s resource list here. Importing 30GB of data in R with sparklyr - Econometrics and Free Software. February 16, 2018 Disclaimer: the first part of this blog post draws heavily from Working with CSVs on the Command Line, which is a beautiful resource that lists very nice tips and tricks to work with CSV files before having to load them into R, or any other statistical software.
I highly recommend it! Also, if you find this interesting, read also Data Science at the Command Line another great resource! In this blog post I am going to show you how to analyze 30GB of data. 30GB of data does not qualify as big data, but it’s large enough that you cannot simply import it into R and start working on it, unless you have a machine with a lot of RAM. R markdown blog template. This blog post is mostly for myself but maybe it’s useful to others. It contains my current R markdown blog template. I initially posted this as a question at StackOverflow. Then I read how much a burden we put in Yihui Xie and decided that my current setup (copy-pasting) works just fine. In any case using blogdown with the RStudio IDE is much simpler than what I used to do in the past with jekyll or with even my prior setup with blogdown. Bibliography setup. Packages for Getting Started with Time Series Analysis in R. A. Motivation During the recent RStudio Conference, an attendee asked the panel about the lack of support provided by the tidyverse in relation to time series data.
As someone who has spent the majority of their career on time series problems, this was somewhat surprising because R already has a great suite of tools for visualizing, manipulating, and modeling time series data. I can understand the desire for a ‘tidyverse approved’ tool for time series analysis, but it seemed like perhaps the issue was a lack of familiarity with the available toolage. Therefore, I wanted to put together a list of the packages and tools that I use most frequently in my work. Dplyr, (mc)lapply, for-loop and speed. I was at EdinbR on Friday evening and David Robinson‘s talk prompted some excellent discussions, not least with Isla and Gergana. One topic was on dplyr and lapply. Tired of using Helvetica in your R graphics? Here’s how to use the fonts you like. Codehelp/reorder.md at master · jtr13/codehelp. DataExplorer: Fast Data Exploration With Minimum Code (Revolutions) By Boxuan Cui, Data Scientist at Smarter Travel Once upon a time, there was a joke:
Introduction to linear mixed models. By Gabriela K Hajduk on March 15, 2017 This is a workshop is aimed at people new to mixed modeling and as such it doesn’t cover all the nuances of mixed models, but hopefully serves as a starting point when it comes to both the concepts and the code syntax in R. There are no equations used to keep it beginner friendly. Acknowledgements: First of all, thanks where thanks are due. This tutorial has been built on the tutorial written by Liam Bailey, who has been kind enough to let me use chunks of his script as well as some of the data. Having this backbone of code made my life much, much easier, so thanks Liam, you are a star! RStudio Keyboard Shortcuts for Pipes. Statistical Review of World Energy. Speeding up package installation. Can’t be bothered reading, tell me now A simple one line tweak can significantly speed up package installation and updates.
The wonder of CRAN. Measuring & Monitoring Internet Speed with R. Big Data Analytics with H20 in R Exercises -Part 1. R-exercises – Big Data Analytics with H20 in R Exercises -Part 1. Pretty Tables with Pipelines. Accessing patent data with the patentsview package. Why care about patents? 1. Patents play a critical role in incentivizing innovation, without which we wouldn't have much of the technology we rely on everyday What does your iPhone, Google's PageRank algorithm, and a butter substitute called Smart Balance all have in common? ...They all probably wouldn't be here if not for patents. A patent provides its owner with the ability to make money off of something that they invented, without having to worry about someone else copying their technology. 2. Enterprise-ready dashboards with Shiny and databases · R Views. R Markdown for documents with logos, watermarks, and corporate styles. Non-standard evaluation, how tidy eval builds on base R – That's so Random.
As with many aspects of the tidyverse, its non-standard evaluation (NSE) implementation is not something entirely new, but built on top of base R. What makes this one so challenging to get your mind around, is that the Honorable Doctor Sir Lord General and friends brought concepts to the realm of the mortals that many of us had no, or only a vague, understanding of.
How to make a global map in R, step by step - SHARP SIGHT LABS. Measurement units in R. Characterizing Twitter followers with tidytext. Bigrquery 0.4.0. Useful tricks when including images in Rmarkdown documents. Track changes in data with the lumberjack %>>% Wrapr Implementation Update – Win-Vector Blog. How to make and share an R package in 3 steps. When the LASSO fails??? R - Dynamic limits and breaks in scale_y_continuous. Thinking inside the box. Weather forecast with regression models – part 1. Complete Subset Regressions, simple and powerful. U.S. Residential Energy Use: Machine Learning on the RECS Dataset. A tidy model pipeline with twidlr and broom. Storytelling with data. Oakland Real Estate – Full EDA. Data Science for Business – Time Series Forecasting Part 1: EDA & Data Preparation.
Create smooth animations in R with the tweenr package. Coblis — Color Blindness Simulator. The viridis color palettes. Unsupervised Learning and Text Mining of Emotion Terms Using R. NiceOverPlot, or when the number of dimensions does matter. Timekit: Time Series Forecast Applications Using Data Mining. R for Data Science. Happy Git and GitHub for the useR. Sign Up. Test driving Python integration in R, using the ‘reticulate’ package. How to store and use webservice keys and authentication details with R. Best practices for writing an API package. Setting your working directory permanently in R. Fitting a rational function in R using ordinary least-squares regression. Take your data frames to the next level. UK government using R to modernize reporting of official statistics. The one thing you need to master data science. Selecting columns and renaming are so easy with dplyr. Why I love R Notebooks. Lesser known dplyr tricks – R-bloggers.
R Markdown: How to format tables and figures in .docx files. R Markdown: How to number and reference tables. Using knitr and pandoc to create reproducible scientific reports. Analytical and Numerical Solutions to Linear Regression Problems. Maximize manufacturing profit. Optimize! From Descriptive to Prescriptive Analytics. RSQLite: Write a local data frame or file to the database. R and SQLite: Part 1. R: Monitoring the function progress with a progress bar. A wrapper around nested ifelse. Online Text Correction. How to combine multiple CSV files into one using CMD - Markdown Tables generator - TablesGenerator.com. Version Control, File Sharing, and Collaboration Using GitHub and RStudio.
The “Ten Simple Rules for Reproducible Computational Research” are easy to reach for R users. Empirical Software Engineering using R: first draft available for download. Implementation of a basic reproducible data analysis workflow. Principal Component Analysis. Implementation of a basic reproducible data analysis workflow. Endole: Business Information Company Check. How to really do an analysis in R (part 1, data manipulation) - SHARP SIGHT LABS.
Ggedit – interactive ggplot aesthetic and theme editor.