
Data, data everywhere. WHEN the Sloan Digital Sky Survey started work in 2000, its telescope in New Mexico collected more data in its first few weeks than had been amassed in the entire history of astronomy.
Now, a decade later, its archive contains a whopping 140 terabytes of information. A successor, the Large Synoptic Survey Telescope, due to come on stream in Chile in 2016, will acquire that quantity of data every five days. Such astronomical amounts of information can be found closer to Earth too. Wal-Mart, a retail giant, handles more than 1m customer transactions every hour, feeding databases estimated at more than 2.5 petabytes—the equivalent of 167 times the books in America's Library of Congress (see article for an explanation of how data are quantified). Facebook, a social-networking website, is home to 40 billion photos.
All these examples tell the same story: that the world contains an unimaginably vast amount of digital information which is getting ever vaster ever more rapidly. Dross into gold. 10 best book and library infographics of 2015. In the list below, you’ll find the most spectacular and engaging infographics about books, libraries, and reading, that were created in 2015.
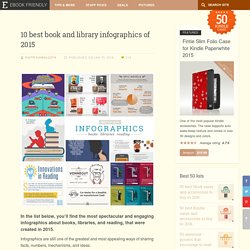
Infographics are still one of the greatest and most appealing ways of sharing facts, numbers, mechanisms, and ideas. When it comes to books, libraries, and everything related to writing and reading, it was a good year. And very well documented in numerous charts, infographics, and other visuals. One big trend to observe in 2015 was about highlighting characters, objects, props, or quotes from the works of literature.
We’ve seen memorable literary animals, plants, or monsters. There is also an infographic (and you can see it below) that lists most famous fictional books – the ones you can read about in other books, but can’t actually read. Click or tap on each infographic to open it in full resolution. 10 best book and library infographics of 2015 1. Parents don’t have to be convinced their children should be reading more. . ⇢ Credits and more info. So you want to be a Data Visualization Librarian? So you know that you want to be a librarian, but have you thought about specializing in a certain field?
Maybe you have an interest in emerging technologies or you want to work with researchers and students across the disciplines? Data visualization is a hot topic in librarianship, and specializations in data analytics and visualization is an exciting area of growth in the profession. I sat down with four visualization specialists who work within the University of Michigan Library system to get an idea of what their jobs entail. Meet our contributors: Marci Brandenburg is a bioinformationist at the Taubman Health Sciences Library at the University of Michigan. Justin Joque is a visualization librarian at the University of Michigan Library. Stephanie O’Malley is an Interactive Imaging and Production Specialist at the University of Michigan’s 3D Lab. Ted Hall is an Advanced Visualization Specialist also at the University of Michigan’s 3D Lab. 1. 2. 3. 4. Stephanie: I would say think big. David McCandless.
10 Tips for (journalists) Designing Infographics. This article was originally published on “Digital Newsgathering”, a class blog for Journalism 226 at San Francisco State University, Instructor: Staci Baird.
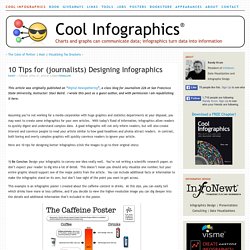
I wrote this post as a guest author, and with permission I am republishing it here. Assuming you’re not working for a media corporation with huge graphics and statistics departments at your disposal, you may want to create some infographics for your own articles. With today’s flood of information, infographics allow readers to quickly digest and understand complex data. A good infographic will not only inform readers, but will also create interest and convince people to read your article similar to how good headlines and photos attract readers.
In contrast, both boring and overly complex graphics will quickly convince readers to ignore your article. Here are 10 tips for designing better infographics (click the images to go to their original sites): 1) Be Concise: Design your infographic to convey one idea really well. Create and share visual ideas online.