
Cohen's kappa in SPSS - Procedure, output and interpretation of the output using a relevant example. Introduction In research designs where you have two or more raters (also known as "judges" or "observers") who are responsible for measuring a variable on a categorical scale, it is important to determine whether such raters agree.
Cohen's kappa (κ) is such a measure of inter-rater agreement for categorical scales when there are two raters (where κ is the lower-case Greek letter 'kappa'). There are many occasions when you need to determine the agreement between two raters. For example, the head of a local medical practice might want to determine whether two experienced doctors at the practice agree on when to send a patient to get a mole checked by a specialist. Both doctors look at the moles of 30 patients and decide whether to "refer" or "not refer" the patient to a specialist (i.e., where "refer" and "not refer" are two categories of a nominal variable, "referral decision").
SPSStop ^ Assumptions Cohen's kappa has five assumptions that must be met. Difference between ANOVA and MANOVA? Thanks Vagelas, Explanation and provided links are very useful and helpful Dear Abdul, “ANOVA” stands for “Analysis of Variance” while “MANOVA” stands for “Multivariate Analysis of Variance.”The ANOVA method includes only one dependent variable while the MANOVA method includes multiple, dependent variables.ANOVA uses three different models for experimentations; random-effect, fixed-effect, and multiple-effect methods to determine the differences in means which is its main objective while MANOVA determines if the dependent variables get significantly affected by changes in the independent variables.

Further reading Dear Dr Muhammad, We can use MANOVA as far as we want to test the relationship between the treatments and two or more metric dependent variables. Y1=X1+X2+X3+... Y1+Y2+Y3+... Best regards Thanks Dr. Exact Unconditional Tests. FAQ 1790 - Choosing a statistical test. This is chapter 37 of the first edition of Intuitive Biostatistics by Harvey Motulsky.
Copyright © 1995 by Oxford University Press Inc. Chapter 45 of the second edition of Intuitive Biostatistics is an expanded version of this material. This book has discussed many different statistical tests. To select the right test, ask yourself two questions: What kind of data have you collected? What is your goal? Choosing the right test to compare measurements is a bit tricky, as you must choose between two families of tests: parametric and nonparametric. Tests that do not make assumptions about the population distribution are referred to as nonparametric- tests. Choosing between parametric and nonparametric tests is sometimes easy.
Free Effect Size (Cohen's d) Calculator for a Student t-Test. How do I analyze data in SPSS for Z-scores? Background | Enter Data | Analyze Data | Interpret Data | Report Data Analyze Click “Analyze,” “Descriptive Statistics,” and then “Descriptives.”
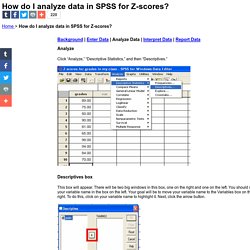
Descriptives box This box will appear. There will be two big windows in this box, one on the right and one on the left. You should see Your variable name should move to the box on the right. Click OK When you are finished, click the OK button and wait a few seconds for processing. An output file will appear You will see some descriptive statistics for your data set like the number of scores (N), minimum and maximum score, the mean and the Standard Deviation. It’s interesting. How do I interpret data in SPSS for Pearson's r and scatterplots? Correlations Box Take a look at the first box in your output file called Correlations.
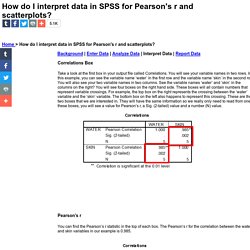
You will see your variable names in two rows. In this example, you can see the variable name ‘water’ in the first row and the variable name ‘skin’ in the second row. You will also see your two variable names in two columns. See the variable names ‘water’ and ‘skin’ in the columns on the right? Pearson’s r. How to Analysis Data with Low Quality or Small Samples, Nonparametric Statistics.
General Purpose Brief review of the idea of significance testing.

To understand the idea of nonparametric statistics (the term nonparametric was first used by Wolfowitz, 1942) first requires a basic understanding of parametric statistics. Elementary Concepts introduces the concept of statistical significance testing based on the sampling distribution of a particular statistic (you may want to review that topic before reading on). In short, if we have a basic knowledge of the underlying distribution of a variable, then we can make predictions about how, in repeated samples of equal size, this particular statistic will "behave," that is, how it is distributed. For example, if we draw 100 random samples of 100 adults each from the general population, and compute the mean height in each sample, then the distribution of the standardized means across samples will likely approximate the normal distribution (to be precise, Student's t distribution with 99 degrees of freedom; see below).
Gamma. How to Use SPSS: Intra Class Correlation Coefficient. IBM Knowledge Center. Introduction to ANOVA / MANOVA. A general introduction to ANOVA and a discussion of the general topics in the analysis of variance techniques, including repeated measures designs, ANCOVA, MANOVA, unbalanced and incomplete designs, contrast effects, post-hoc comparisons, assumptions, etc.

For related information, see also Variance Components (topics related to estimation of variance components in mixed model designs), Experimental Design/DOE (topics related to specialized applications of ANOVA in industrial settings), and Repeatability and Reproducibility Analysis (topics related to specialized designs for evaluating the reliability and precision of measurement systems).
See also, General Linear Models and General Regression Models; to analyze nonlinear models, see Generalized Linear Models. Basic Ideas. Multiple Regression. General Purpose The general purpose of multiple regression (the term was first used by Pearson, 1908) is to learn more about the relationship between several independent or predictor variables and a dependent or criterion variable.

For example, a real estate agent might record for each listing the size of the house (in square feet), the number of bedrooms, the average income in the respective neighborhood according to census data, and a subjective rating of appeal of the house. Once this information has been compiled for various houses it would be interesting to see whether and how these measures relate to the price for which a house is sold.
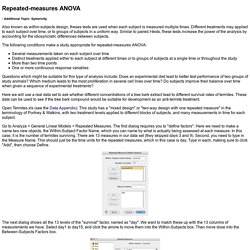
Parametric versus non-parametric. Repeated-measures ANOVA. Also known as within-subjects design, theses tests are used when each subject is measured multiple times.
Research Methods - Measurement scales. A topic which can create a great deal of confusion in social and educational research is that of types of scales used in measuring behaviour.
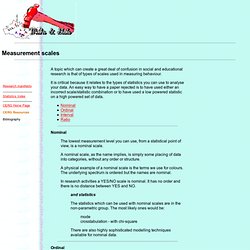
It is critical because it relates to the types of statistics you can use to analyse your data. An easy way to have a paper rejected is to have used either an incorrect scale/statistic combination or to have used a low powered statistic on a high powered set of data. Nominal The lowest measurement level you can use, from a statistical point of view, is a nominal scale. A nominal scale, as the name implies, is simply some placing of data into categories, without any order or structure. Statistical Tests in SPSS.
What statistical analysis should I use? Statistical analyses using SPSS Introduction. Types of Statistical Tests. Now that you have looked at the distribution of your data and perhaps conducted some descriptive statistics to find out the mean, median or mode, it is time to make some inferences about the data.