
Top 5 graph visualisation tools. Data visualisation is the process of displaying data in visual formats such as charts, graphs or maps.
This method is commonly used to grasp more meaning out of a snapshot of data which in other approaches might require sorting through piles of spreadsheets and great quantity of reports. With the amount of data growing rapidly it is more important than ever to interpret all of this information correctly and quickly to make well-informed business decisions. Graph visualisation has a fairly similar approach just with a more diverse and complex sets of data. A graph is a representation of objects (nodes) which some are connected by links. Graph visualisation is the process of displaying this data graphically to maximise readability and allow to gain more insight. Here is the list of top graph visualisation tools that Data to Value found useful. Gephi Gephi is an interactive visualization and exploration solution that supports dynamic and hierarchical graphs.
Tom Sawyer Perspectives Keylines. Gruff: A Grapher-Based Triple-Store Browser for AllegroGraph. The paragraphs below describe select features of the latest versions of Gruff.
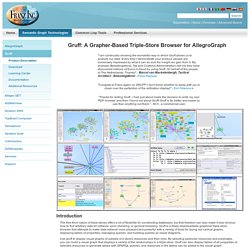
For a complete listing of the new features, see the Release History New in Version 5.2: SPARQL Endpoint Connections Gruff now allows users to connect and browse SPARQL Endpoints directly, without using an AllegroGraph database. This feature is currently available in Beta and requires a password to enable the functionality. Please contact info@franz.com to participate in the Beta program and obtain the password. Screenshots The new child menu "Global Options | SPARQL Endpoints" contains options that are specific to SPARQL endpoints, mostly to disable certain capabilities by default that may typically be too slow for an endpoint; in particular, label properties are not displayed by default with endpoints, but they can be. New in Version 5: Spring Layout View The constraint-based algorithm while better for clear viewing of the graph requires more RAM when you want to view a very large graph on screen. From Wikipedia.
Visualization.
Ontology Visualization. People - Visual Data Web. The top 20 data visualisation tools. Graphviz. D3. Hyperbolic tree. A basic hyperbolic tree.
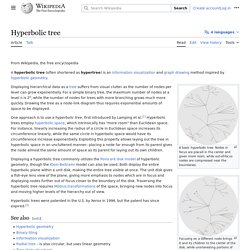
Nodes in focus are placed in the center and given more room, while out-of-focus nodes are compressed near the boundaries. Focusing on a different node brings it and its children to the center of the disk, while uninteresting portions of the tree are compressed. One approach is to use a hyperbolic tree, first introduced by Lamping et al.[1] Hyperbolic trees employ hyperbolic space, which intrinsically has "more room" than Euclidean space. For instance, linearly increasing the radius of a circle in Euclidean space increases its circumference linearly, while the same circle in hyperbolic space would have its circumference increase exponentially. Exploiting this property allows laying out the tree in hyperbolic space in an uncluttered manner: placing a node far enough from its parent gives the node almost the same amount of space as its parent for laying out its own children.
Hyperbolic trees have been patented in the U.S. by Xerox.[2] See also[edit] References[edit] Tree Set Visualization Project. Phylogenetic trees provide valuable information about evolutionary relationships and are powerful tools used in many areas of biology.
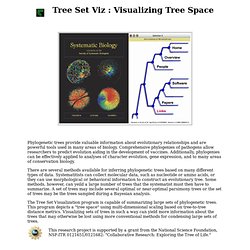
Comprehensive phylogenies of pathogens allow researchers to predict evolution aiding in the development of vaccines. Additionally, phylogenies can be effectively applied to analyses of character evolution, gene expression, and to many areas of conservation biology. There are several methods available for inferring phylogenetic trees based on many different types of data. Systematitists can collect molecular data, such as nucleotide or amino acids, or they can use morphological or behavioral information to construct an evolutionary tree. Some methods, however, can yeild a large number of trees that the systematist must then have to summarize. The Tree Set Visualization program is capable of summarizing large sets of phylogenetic trees.
yEd - Graph Editor. Diagram Creation yEd makes diagram creation easy and fun with its powerful features and intuitive user interface.
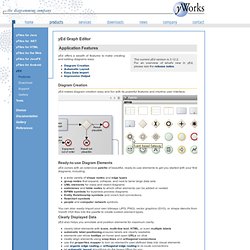
Ready-to-use Diagram Elements yEd comes with an extensive palette of beautiful, ready-to-use elements to get you started with your first diagrams, including: a wide variety of shape nodes and edge types group nodes that expand, collapse, and nest to tame large data sets UML elements for class and object diagrams swimlanes and table nodes to which other elements can be added or nested BPMN symbols for business process diagrams Entity Relationship symbols and crow's foot connections flowchart symbols people and computer network symbols You can also easily import your own bitmaps (JPG, PNG), vector graphics (SVG), or shape stencils from Visio® VSX files into the palette to create custom element types. Visualization. Information Is Beautiful.