
Stagemonitor. 80 Linux Monitoring Tools for SysAdmins. It’s hard work monitoring and debugging Linux performance problems, but it’s easier with the right tools at the right time.
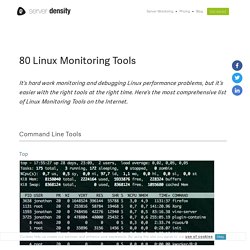
Here’s the most comprehensive list of Linux Monitoring Tools on the Internet. Command Line Tools Top This is a small tool which is pre-installed on many unix systems. When you want an overview of all the processes or threads running in the system: top is a good tool. Htop Htop is essentially an enhanced version of top. Atop Atop monitors all processes much like top and htop, unlike top and htop however it has daily logging of the processes for long-term analysis.
Apachetop Apachetop monitors the overall performance of your apache webserver. Ftptop ftptop gives you basic information of all the current ftp connections to your server such as the total amount of sessions, how many are uploading and downloading and who the client is. mytop mytop is a neat tool for monitoring threads and performance of mysql. Powertop iotop Desktop Monitoring ntopng iftop jnettop bandwidthd EtherApe ss w. Counting & Timing. Here at Flickr, we’re pretty nerdy.
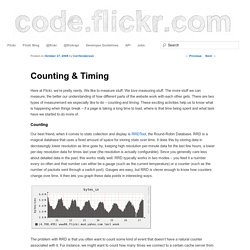
We like to measure stuff. We love measuring stuff. The more stuff we can measure, the better our understanding of how different parts of the website work with each other gets. There are two types of measurement we especially like to do – counting and timing. These exciting activities help us to know what is happening when things break – if a page is taking a long time to load, where is that time being spent and what task have we started to do more of. Counting Our best friend, when it comes to stats collection and display is RRDTool, the Round-Robin Database. The problem with RRD is that you often want to count some kind of event that doesn’t have a natural counter associated with it. The easiest way to do this is to use a database. There’s luckily an operation which we can perform that’s cheap enough to do very often while allowing us to easily collect data from multiple servers at once: UDP.
In our client code, this is very easy to do. Perl Timing. Sentry: Track exceptions with modern error logging for JavaScript, Python, Ruby, Java, and Node.js. Monitoring at Spotify: Introducing Heroic. This is the second part in a series about Monitoring at Spotify.
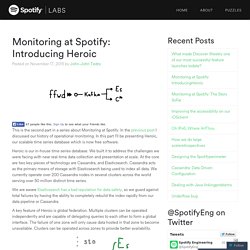
In the previous post I discussed our history of operational monitoring. In this part I’ll be presenting Heroic, our scalable time series database which is now free software. Heroic is our in-house time series database. We built it to address the challenges we were facing with near real-time data collection and presentation at scale. At the core are two key pieces of technology are Cassandra, and Elasticsearch. We are aware Elasticsearch has a bad reputation for data safety, so we guard against total failures by having the ability to completely rebuild the index rapidly from our data pipeline or Cassandra. A key feature of Heroic is global federation. Every host in our infrastructure is running ffwd, which is an agent responsible for receiving and forwarding metrics. This setup allows us to rapidly experiment with our service topology.
In the backend everything is stored exactly as it was provided to the agent. Application Performance Management (FR) Packetbeat : Espoir pour l’APM Open Source ? Application Performance Management & Monitoring.