
Using R for Multivariate Analysis. Plotting Multivariate Data Once you have read a multivariate data set into R, the next step is usually to make a plot of the data.
A Matrix Scatterplot One common way of plotting multivariate data is to make a “matrix scatterplot”, showing each pair of variables plotted against each other. We can use the “scatterplotMatrix()” function from the “car” R package to do this. Cross Validated. Machine learning project. Eleven Multivariate Analysis Techniques Article. Eleven Multivariate Analysis Techniques: Key Tools In Your Marketing Research Survival Kitby Michael Richarme Situation 1: A harried executive walks into your office with a stack of printouts.
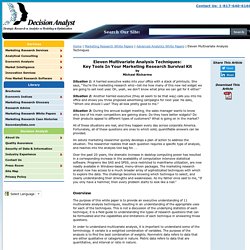
She says, “You’re the marketing research whiz—tell me how many of this new red widget we are going to sell next year. Oh, yeah, we don’t know what price we can get for it either.” Situation 2: Another harried executive (they all seem to be that way) calls you into his office and shows you three proposed advertising campaigns for next year. He asks, “Which one should I use? R Programming. Welcome to the R programming Wikibook This book is designed to be a practical guide to the R programming language[1].
R is free software designed for statistical computing. There is already great documentation for the standard R packages on the Comprehensive R Archive Network (CRAN)[2] and many resources in specialized books, forums such as Stackoverflow[3] and personal blogs[4], but all of these resources are scattered and therefore difficult to find and to compare.
The aim of this Wikibook is to be the place where anyone can share his or her knowledge and tricks on R. It is supposed to be organized by task but not by discipline[5]. Two sample Student’s t-test. T-Test to compare the means of two groups under the assumption that both samples are random, independent, and come from normally distributed population with unknow but equal variances Here I will use the same data just seen in a previous post.
The data are given below: To solve this problem we must use to a Student’s t-test with two samples, assuming that the two samples are taken from populations that follow a Gaussian distribution (if we cannot assume that, we must solve this problem using the non-parametric test called Wilcoxon-Mann-Whitney test; we will see this test in a future post). Before proceeding with the t-test, it is necessary to evaluate the sample variances of the two groups, using a Fisher’s F-test to verify the homoskedasticity (homogeneity of variances). In R you can do this in this way: Choosing the right estimator (Machine Learning)
Caret and parallel processing (Machine Learning) Comparing learning algorithms (Machine Learning) February 27, 2015 · machine learning In the data science course that I instruct, we cover most of the data science pipeline but focus especially on machine learning.
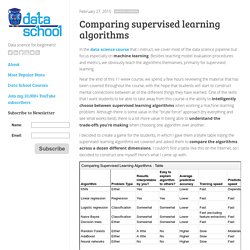
Besides teaching model evaluation procedures and metrics, we obviously teach the algorithms themselves, primarily for supervised learning. Near the end of this 11-week course, we spend a few hours reviewing the material that has been covered throughout the course, with the hope that students will start to construct mental connections between all of the different things they have learned. One of the skills that I want students to be able to take away from this course is the ability to intelligently choose between supervised learning algorithms when working a machine learning problem.