
Hive Cheat Sheet - Download in PDF & JPG Format - Intellipaat. Size and Lay Out Your Dashboard - Tableau. After you create a dashboard, you might need to resize and reorganize it to work better for your users.
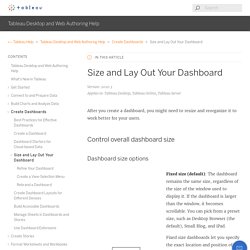
Control overall dashboard size Tip: If you use Tableau Desktop, see Create Dashboard Layouts for Different Device Types to create unique layouts optimized for desktop computers, tablets, and phones. In addition to adapting to different screen sizes, each device layout can contain different items. Set overall dashboard size Under Size on the Dashboard pane, select the dashboard's dimensions (such as Desktop Browser) or sizing behavior (for example, Automatic).
Group items using layout containers Layout containers let you group related dashboard items together so you can quickly position them. A horizontal layout container resizes the width of the views and objects it contains; a vertical layout container adjusts height. Under Objects on the Dashboard pane, select Horizontal or Vertical. Evenly distribute a layout container's items Select the layout container. 7 tips and tricks from the dashboard experts. Comparing European Football Players. Design tricks for great dashboards. The Laws of Figure/Ground, Prägnanz, Closure, and Common Fate - Gestalt Principles (3) We’re now going to take a look at some more Gestalt principles, building on what we’ve learned in the first two articles. This third piece is particularly useful because having a good grasp of Figure/Ground, Prägnanz, Closure, and Common Fate will enhance your ability to design with more thoughtfulness, confident that you’re making the best use of some basic human tendencies to access your design and its impact.
“The eye tends to build a relationship between elements, it fills in the gaps, and identifies hidden motion in the design.” Figure/Ground, Prägnanz, Closure, and Common Fate are Gestalt Principles that help the eye build these relationships: The Figure/Ground law examines how the eye can separate shapes in a design from the background of that design. The Prägnanz law shows how our eyes can simplify complex shapes into simple shapes. This article is the third in the Gestalt series.
The Importance of BI Documentation. Why Is BI Documentation Important?
Business intelligence systems come with a lot of extra information. Even beautifully constructed analyses have piles of background information and histories. Administrators might often have memos and updates that they’d like share with analysts. Documentation Document for Dashboards? : tableau. 4ED Tableau2Tableau Tableau Workbook Documenter. The 50 Best Free Datasets for Machine Learning. This article is also available in Japanese and Simplified Chinese.

Lionbridge AI has assembled a wealth of resources for machine learning and natural language processing activities. In our previous articles, we explained why datasets are such an integral part of machine learning and natural language processing. Without training datasets, machine-learning algorithms would have no way of learning how to do text mining, text classification, or categorize products. 7 public data sets you can analyze for free right now. Hey, data is everywhere.
You probably knew that by now, since it’s kind of hard to overlook it when it’s constantly in the news, a growing professional field, and data skills are increasingly valuable in every job market. However, data isn’t just for big businesses and you don’t have to collect your own data to analyze it. There are tons of public data sets out there! If you’re looking to learn how to analyze data, create data visualizations, or just boost your data literacy skills, public data sets are a perfect place to start. Parameter Actions: Layered Analysis. R squared in Excel - Excelchat. R squared is an indicator of how well our data fits the model of regression.

Also referred to as R-squared, R2, R^2, R2, it is the square of the correlation coefficient r. The correlation coefficient is given by the formula: Figure 1. Dimensions and Measures, Blue and Green - Tableau. When you connect to a new data source, Tableau assigns each field in the data source as dimension or measure in the Data pane, depending on the type of data the field contains.
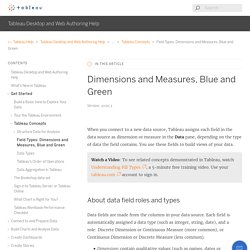
You use these fields to build views of your data. Watch a Video: To see related concepts demonstrated in Tableau, watch Understanding Pill Types, a 5-minute free training video. Use your tableau.com account to sign in. About data field roles and types. The Tableau Data Model - Tableau. Every data source that you create in Tableau has a data model.
You can think of a data model as a diagram that tells Tableau how it should query data in the connected database tables. The tables that you add to the canvas in the Data Source page create the structure of the data model. Tableau Workbook Documentation Tool. Sample. RapidDox - Tableau Dashboard Documentation in Seconds. RapidDox is a one of its kind product that works seamlessly with your Tableau workbook and dashboards to help automate 100% of the effort spent on documenting important details from your workbooks.
Not only this, RapidDox helps Tableau users improve the performance of their dashboards by helping them follow industry best practices. This article explains how you can create an awesome Tableau documentation within seconds and save up to 8-10 hours per workbook .Do you feel overwhelmed with everything you want to get done quickly? Since time immemorial, all of man’s efforts have been directed at one thing: making life easier. 4ED Tableau2Tableau Tableau Workbook Documenter. How to Improve Your Tableau Work with Documentation. When I first started out as a Tableau developer, I was just trying to make sure my calculations didn’t result in errors and the dashboard rendered properly on Server.
But as time went on, the caliber of dashboards became more complex and the number of developers on a project increased; I soon realized I needed a way to keep track of the inner workings behind the visualizations. Here are a few best practices I have found to be beneficial when building dashboards so that others (and future me) can understand what’s going on behind the scenes.