
15 Best Web AR Platforms and Tools [2021] WebAR: no app, no coding hassle WebAR technology creates an immersive experience meaning you need just a browser to pull the magic in your camera.
![15 Best Web AR Platforms and Tools [2021]](http://cdn.pearltrees.com/s/pic/th/best-web-platforms-tools-2021-257525471)
It’s commonly known and valued for: What America’s Death Spiral Teaches Us About How Societies Die. Some charts are just charts.

Others tell stories, great and grave, stories which teach the lessons of history. Take a look at the two charts above. What story do they tell? They begin to teach us how societies collapse. Let me explain — though I’m sure you’ve already gotten the gist. 6 errores que evitar para crear el dashboard perfecto en Power BI - Algoritmia.
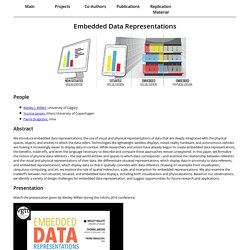
Open Data Challenge - Joanna Choukeir. I worked with Uscreates, Nesta and The ODI, directing design support throughout the one-year-long Open Data Challenge Series programme.
The challengeNesta and the Open Data Institute were running their Open Data Challenges programme. The programme consists of seven social challenge prizes, which are awarded to innovative, financially sustainable and socially-focused service ideas that use open data as part of their core value proposition. Challenge themes included criminal justice; education; energy and environment; housing; food; heritage and culture; jobs. In order to maximise social impact of the programmes, Nesta and the Open Data Institute needed to ensure that the teams who applied for prizes were basing their innovations on both real need and market opportunity. What was neededSpecialist capacity was required to provide expertise in user and market research.
Visualizing the Critical Metals in a Smartphone. Big Tech CEO Insider Trading During The First Half of 2021 When CEOs of major companies are selling their shares, investors can’t help but notice.

After all, these decisions have a direct effect on the personal wealth of these insiders, which can say plenty about their convictions with respect to the future direction of the companies they run. Considering that Big Tech stocks are some of the most popular holdings in today’s portfolios, and are backed by a collective $5.3 trillion in institutional investment, how do the CEOs of these organizations rank by their insider selling? Best of the visualisation web... January 2021 - Visualising Data. At the end of each month I pull together a collection of links to some of the most relevant, interesting or thought-provoking web content I've come across during the previous month.
Here's the latest collection from January 2021. Notes: the items listed may not have been necessarily published during this month, rather discovered during the month. Some links point to paywall items. The details shown below label the platform/site each item is published on - not necessarily the actual author - and a brief selective description.
Visualisations & Infographics. Decolonizing Data Viz. What is Data Visualization?

A visual representation ofquantitative or qualitative data. so says Stephanie Evergreen. The strength of this definition is that it is so broad, lots of things fit under its umbrella. But perhaps that is also its weakness because it leaves what counts as data open to interpretation and this is where the problem lies. Often, people with power and privilege are the ones who get to do the interpreting about what’s in and what’s out. Crunched: US abortion law, what the numbers tell us. You can enable subtitles (captions) in the video player Abortion has been in the news recently.

And a lot of that is because over the last few months several US states have tried to restrict the situations when women can have an abortion. Yeah, and I'm really puzzled by this because you'd think that there would be a reaction to abortion rates going up. But in fact, they're going down. So the question is, why are these restrictions coming in? A view on despair, a datavisualization project by STUDIO TERP – STUDIO TERP. Let’s just begin with the most frightening part and give you a glimpse of the darkness in me.

You know, the part most people try to ignore, suppress or hide because… Because, well, the pain, the shame, the fear. Something (often: many things) went wrong and you just can’t cope. How to pitch a campaign in only 4 slides. A simple static visualization can often be the best approach. One of the things that stuck out to me immediately (besides the wonky color palette) was the fact that it was tough to compare (or even see) the difference between male and female figures.
As a result, my mind immediately jumped to the interactions that I had been learning about. I decided to take the map of Africa (which had mortality rates) and map that interaction to a series of interactive bar charts that would easily showcase the difference between the male and female statistics in many different categories. It looked cool, made for easy comparison, and the tooltip that popped up when clicking on a country was an interesting way to see how a country’s statistics compared with the average for Sub-Saharan Africa. It also completely missed the point of the visualization. But it wasn’t until after watching the Visualization Review that #MakeoverMonday does with the dataset that I noticed my mistake.
Yvonne Jansen - Embedded Data Representations. People Wesley J.
Willett, University of Calgary Yvonne Jansen, (then) University of Copenhagen Pierre Dragicevic, Inria Abstract. Instagram. Instagram. Jon en Instagram: “area chart, by Post Melon □. Now out on iTunes.…” HOLO en Instagram: ““Often when I’m pressed for time I switch to the ‘let’s create something’ mentality rather quickly. I would love to have as much time for…” Hans Rosling Adopts Physical Visualizations. Hans Rosling is famous worldwide for his fascinating speeches about population growth and income inequalities, notably his 2006 TED Talk where he debunks myths about the third world using animated charts. In 2010 he started to tell stories about data using physical visualizations. He started by stacking Ikea boxes, then switched to a variety familiar objects including pebbles, toy construction kits, fruit juice, snow balls and even toilet paper. Hans' son Ola Rosling is behind the technology and scenography used in his talks.
Both strongly believe in the pedagogical power of physical visualizations. Hans Rosling Adopts Physical Visualizations. Data Visualization - A Look into the Biases, Questions & Types. “By visualizing information, we turn it into a landscape that you can explore with your eyes, a sort of information map.” – David McCandless As times go by we have become proficient at collecting data, but have we become better at explaining what it all means. That’s still a question that we are yet to find an answer. So let’s divulge deeper, which do you consider most important in data visualization : the Data or the Audience ??
The good, the bad, and the biased: Five ways visualizations can mislead (and how to fix them) Authors: Danielle Szafir Data visualizations allow people to readily explore and communicate knowledge drawn from data. Visualization methods range from standard scatterplots and line graphs to intricate interactive systems for analyzing large data volumes at a glance. Challenge – #AnatomyOfAction. Giorgia Lupi. If you would like to reproduce an image of a work of art in MoMA’s collection, or an image of a MoMA publication or archival material (including installation views, checklists, and press releases), please contact Art Resource (publication in North America) or Scala Archives (publication in all other geographic locations). All requests to license audio or video footage produced by MoMA should be addressed to Scala Archives at firenze@scalarchives.com.
Motion picture film stills or motion picture footage from films in MoMA’s Film Collection cannot be licensed by MoMA/Scala. Visualization Research. MIT Senseable City Lab. Understanding and promoting urban tree cover has never been more important. Increasing a city’s tree canopy contributes to lowering urban temperatures by blocking shortwave radiation and increasing water evaporation. Creating more comfortable microclimates, trees also mitigate air pollution caused by everyday urban activities. Their absorptive root systems also help avoid floods during severe rains and storm surges.
So overall, trees are pretty awesome. Cities around the world are recognizing this and many are developing strategies to increase green canopy cover. MIT Senseable City Lab. Projects – UCLAB – FH Potsdam. MIT Senseable City Lab. Árboles de Bogotá. Browse by Item Type - e-artexte. Out of Sight, Out of Mind: A visualization of drone strikes in Pakistan since 2004. Explore data visualisation with p5.js. "Live Logo" - INEC (Maruri Grey Ecuador) What is social media listening & why is it important?