
Value Chain –In Clinical Research Industry. – bidyutword. Value Chain –In Clinical Research Industry.
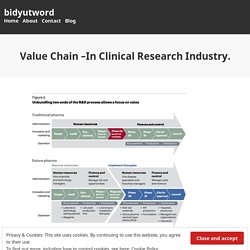
Introduction- In 1990s, the marketing that could be performed by the pharmaceutical industry expanded and more focused on global market. Due to the rise of the Internet, consumers could purchase non-prescription drugs directly from the producers and companies have been able to market direct-to-consumer through media advertisements. In India before pre liberalization Clinical Research industry not proactive in terms of government regulation, technological advancement, regulatory affairs and industry R&D growth was nil only Gov. initiative project, ICMR, WHO and few Indian private players involved in this process.
White paper Medical Affairs in transition, towards a fully integrated model - Consultancy in Healthcare and Life Sciences. Explore ZS research and insights. Oncology drug launch success elements. Our experience shows that companies who launch oncology drugs successfully excel in four areas: Agility, speed, and competitive mind-set: They operate in an agile governing model allowing for competitive entry and faster approvals.
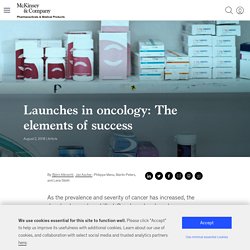
Distinctive product strategy: They have a clearly defined product strategy underscored by strong product planning. Mastering market access: They know how to demonstrate value, are braced for increasingly difficult access negotiations, and effectively manage the evolving stakeholder landscape. The secret of successful drug launches. Pharmaceutical companies have long relied on successfully launching new drugs to drive growth.

This pressure is only likely to increase. Patents are expiring and product pipelines are shrinking. Austerity measures in many countries are increasing local and national hurdles for market access. And, at the same time, launches are becoming more numerous, smaller, and more competitive. We estimate that pharmaceutical companies will launch some 400 new products in the next three years, up 146 percent from 2005. Yet their recent track record is sobering at best. How to Launch a Pharmaceutical Product: 8 Steps. Ch lshc Pharma Launch paradigm. Post Pharma Product Launch & Drug Launch Strategy. Six Technology Trends in the Pharmaceutical Industry. Life sciences companies face unprecedented challenges as revenues come under pressure as a consequence of pricing pressures caused by healthcare reforms and austerity measures, increased competition, and challenges in bringing new drugs and other products to market.
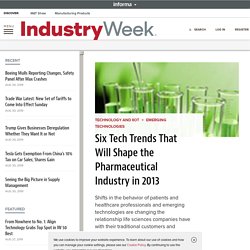
Pharma 2020: Marketing the future - Which path will you take? Which path will you take?
By 2020 the current role of the pharmaceutical industry’s sales and marketing workforce will be replaced by a new model as the industry shifts from a mass-market to a target-market approach to increase revenue. Pharma 2020: Marketing the future - Which path will you take? The third in the Pharma 2020 series, outlines a confluence of dynamics that lead to a new marketing and sales system with a smaller, more agile and smarter sales force. The pharma industry is no longer being rewarded for incremental innovation, me-too products and selling the most pills. A vision for medical affairs strategy in 2025. As innovation transforms the healthcare landscape, science and data are becoming the foundation for pharma to meet its obligations to patients and customers—and realize commercial opportunities.
This imperative is accelerating the evolution of medical affairs as the third strategic pillar of the organization alongside R&D and commercial. Innovation in both digital technology and the bio sciences is advancing at a furious pace, while the quantity of data generated is skyrocketing. Business models are starting to evolve both around and beyond the “product” to encompass the wider therapeutic context, while organizations seek to explain and contextualize the ever-more-complex medical science to a diverse range of stakeholders (physicians, patients, payers). Untitled. Accenture Five Branded Generics Strategies Pharmaceuticals in Emerging Markets.
Emerging markets Compendium 2012. Cost effectivness utility Poland. Directory of HTA Organizations Worldwide. Analysis of Manufacturing Costs in pharma 2008. Analysis of Manufacturing Costs in pharma 2008. Pharmaceuticals fact sheet. Frederick Rein. Top pharma companies by Rx sales and R&D spending 2016. Top pharma companies by Rx sales and R&D spending 2016. Global Pharma Biotech MA Report 2016. IMS Pharmerging WP. Roche acquires mySugr, a digital health business that wants "to make diabetes suck less" - MedCity News.
MySugr logbook app Roche has taken its worldwide collaboration with mySugr to the next level by acquiring the Austrian digital health business.
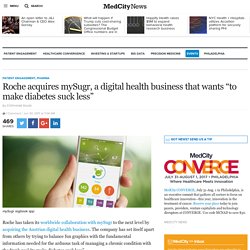
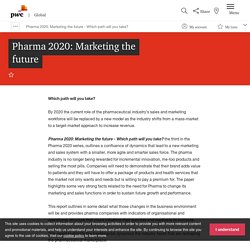
The company has set itself apart from others by trying to balance fun graphics with the fundamental information needed for the arduous task of managing a chronic condition with the frank goal “to make diabetes suck less”. The financial terms of the deal were not disclosed. mySugr’s logbook app guides users to enter relevant information on meals, exercise, glucose levels and mood. LeadershipChallengePharmaceutical. Digital savvy hcp 2017. The Definition of Insane Pharma Marketing. It may have been Einstein who defined insanity as doing the same thing over and over again and expecting different results.
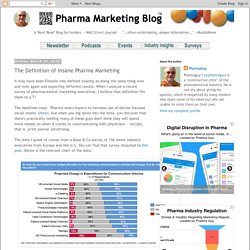
When I analyze a recent survey of pharmaceutical marketing executives, I believe that definition fits them to a T! The headlines read: "Pharma execs expect to increase use of doctor-focused social media" (here), but when you dig down into the data, you discover that there's practically nothing many of these guys don't think they will spend more money on when it comes to communicating with physicians -- except, that is, print journal advertising. The data I speak of comes from a Booz & Co survey of 156 senior industry executives from Europe and the U.S. You can find that survey attached to this post. Below is the relevant chart of the data: First of all, 156 is not a significant N and the error here must be at least ±20 percentage points error. Whatever! Obviously, to believe otherwise is to question your existence on this planet!
SPIMACO ADDWAEIH. A meaningless measure in the era of rebates - PharmaDispatch. Support to research - Benefit-risk methodology. The European Medicines Agency’s opinions are based on balancing the desired effects or ‘benefits’ of a medicine against its undesired effects or ‘risks’.
The Agency can recommend the authorisation of a medicine whose benefits are judged to be greater than its risks. In contrast, a medicine whose risks outweigh its benefits cannot be recommended for marketing. Weighing up the benefits and risks of a medicine is a complex process, since it involves the evaluation of a large amount of data. In addition, there is always some uncertainty around the actual benefits and risks of a medicine, because they can only be determined by looking at the information that is available at a given point in time. The benefit-risk methodology project. DI 0870 E. Patient centricity in pharma, #Defining Value in Pharma #What, How, W… Digital Disruption in Pharma. Digital savvy hcp 2017. Doctors-demand-for-omnipresent-engagement-accelerates-300491483. ISELIN, N.J., July 20, 2017 /PRNewswire/ -- The gap between doctors' preference for in-person engagement and digital engagement is fast closing.
A new global analysis, "The Digital Savvy HCP 2017 Report" by Indegene, reveals that this gap has reduced to just 12%, marking an unprecedented change in the way HCPs want to be engaged today, and in the future. The study found that 62% of global HCPs chose websites and webinars/webcasts as their most preferred digital channels, and nearly 60% preferred to engage with specialized medical science liaisons (MSLs) for their information needs. Merck and Pfizer, the top scoring companies on the HCPs' perception for digital engagement in 2016, lost out their pole position to AstraZeneca, Lilly, and GSK in the 2017 survey. Digital Disruption in Pharma. The Definition of Insane Pharma Marketing. WHO: The International Classification of Diseases. GBD Compare. Gx lshc 2015 health care outlook global. Healthcare expenditure statistics - Statistics Explained.
Data extracted in January 2017. Most recent data: Further Eurostat information, Main tables and Database. Planned article update: October 2017. Table 1: Current healthcare expenditure, 2014Source: Eurostat (hlth_sha11_hf) IMS Pharmerging WP. IMS Pharmerging WP. Top 20 Global Products 2015. Risk sea healthcare 3.0 healthcare for the new normal. Risk sea healthcare 3.0 healthcare for the new normal. Advanced Prostate Cancer Treatment. IDF diabetes atlas - Home. GBD Compare. GBD Compare. About GBD. The Global Burden of Disease: a critical resource for informed policymaking Everyone, all over the world, deserves to live a long life in full health. In order to achieve this goal, we need a comprehensive picture of what disables and kills people across countries, time, age, and sex.
The Global Burden of Disease (GBD) provides a tool to quantify health loss from hundreds of diseases, injuries, and risk factors, so that health systems can be improved and disparities can be eliminated. In order to align health systems with the populations they serve, policymakers first need to understand the true nature of their country’s health challenges – and how those challenges are shifting over time. That means more than just estimating disease prevalence, such as the number of people with depression or diabetes in a population. Classifications and indicators. World Health Statistics 2017: Monitoring health for the SDGs. 2012 ChartBook. Health at a Glance 2015.
MedTech: De reboot van de geneeskunde. LeadershipChallengePharmaceutical. Health at a Glance 2015. Creating Connected Solutions for Better Healthcare Performance. LeadershipChallengePharmaceutical. Drug Innovation > Novel Drug Approvals for 2017. Innovation drives progress. When it comes to innovation in the development of new drugs and therapeutic biological products, FDA’s Center for Drug Evaluation and Research (CDER) supports the pharmaceutical industry at every step of the process. With its understanding of the science used to create new products, testing and manufacturing procedures, and the diseases and conditions that new products are designed to treat, FDA provides scientific and regulatory advice needed to bring new therapies to market.
New Drug Approvals FDA Therapeutic NMEs Since 2003 PDF. Object moved. This new edition of Health at a Glance presents the most recent comparable data on the performance of health systems in OECD countries. Where possible, it also reports data for partner countries (Brazil, China, Colombia, Costa Rica, India, Indonesia, Latvia, Lithuania, Russian Federation and South Africa).
Compared with the previous edition, this new edition includes a new set of dashboards of health indicators to summarise in a clear and user-friendly way the relative strengths and weaknesses of OECD countries on different key indicators of health and health system performance, and also a special focus on the pharmaceutical sector. This edition also contains new indicators on health workforce migration and on the quality of health care. Chapter 1. Health at a Glance 2015 - OECD Indicators - en. Health at a Glance compares key indicators for population health and health system performance across OECD members, candidate and partner countries. It highlights how countries differ in terms of the health status and health-seeking behaviour of their citizens; access to and quality of health care; and the resources available for health. Analysis is based on the latest comparable data across 80 indicators, with data coming from official national statistics, unless otherwise stated.
Alongside indicator-by-indicator analysis, an overview chapter summarises the comparative performance of countries and major trends, including how much health spending is associated with staffing, access, quality and health outcomes. IDF diabetes atlas - Across the globe. Fulltext. Forbes Welcome. PhRMA Generic Price Brief January 2016. IIHI US Use of Meds for 2013.