Untitled. KashimAstro/ofxFurry. OfBook - Advanced graphics. Data Visualization: Designing Maps with Processing and Illustrator. DisplayWidth \ Language (API) \ Processing 2+ DisplayHeight \ Language (API) \ Processing 2+ CreativeApplications.Net. Processing Tutorial #4. Processing Tutorial #5. Unnamed soundsculpture. Audio-generated landscape. Audio Generated Objects 2. Sound Analysis with Processing Libraries. Visualising Sound - Audio Responsive Generative Visuals. Turbulence. Solar. Solar began as a realtime demo that I created for a talk I gave at UCLA in January 2008.
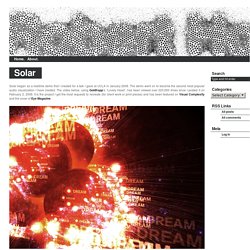
The demo went on to become the second most popular audio visualization I have created. The video below, using Goldfrapp’s “Lovely Head”, has been viewed over 220,000 times since I posted it on February 2, 2008. It is the project I get the most requests to recreate (for client work or print pieces) and has been featured on Visual Complexity and the cover of Eye Magazine. The focus of the talk for UCLA was to show how small steps can combine to form something engaging. I start by showing a single particle, then two particles, then many particles, then add an emitter which can create particles but can also morph into an attractor which pulls particles. I liked the look quite a bit so after I finished the UCLA presentation, I came home and began to make it an audio visualizer.
Robert Hodgin. Processing - Audio reactive Bubbles. Sónar+D inviting applications for MarketLab 2015 / @sonarplusd. Sónar+D is inviting applications to participate at the upcoming MarketLab 2015 (18-20 June, Barcelona).
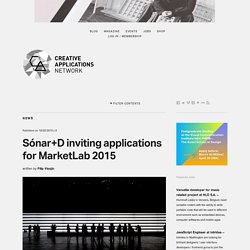
Technology companies, start-ups, creative labs, developers, universities and organizations of all kinds working with creative technologies based on music, audiovisuals, new media and video games, exploring new forms of creation, production, distribution or marketing are all welcome. The products or projects presented can be in the beta phase or may have recently been marketed. The selected projects will be presented during the three days of the festival. MarketLab is the Sónar+D exhibition area where companies and creators present new projects in a dynamic and inspirational environment which facilitates networking and attracts a great deal of professional and media attention. Applications for the selection process can be submitted between December 1st 2014 and March 1st 2015.
Visit Sónar+D for more information and how to submit. Music Hack Day / Sonar 2014. 10 Most Memorable Projects of 2014 / selected by @creativeapps. At CAN we don’t really care for lists.
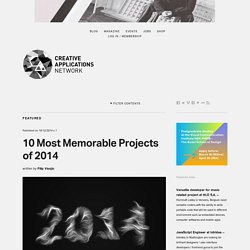
But as we look back as the year winds down, we’re known to make an exception. To keep up with our tradition, today we present our most memorable projects of the year. These works have not only inspired us, but were loved by you. Here’s to an amazing 2014! To see the best of the past, see our collections from 2011, 2012, 2013. 10.
Recent Royal College of Art (RCA) design graduate David Hedberg’s Smile TV is more than a loving homage to the good old ‘campfire inside the living room.’ Visualizing Twitter. In the framework of our researches, we are focusing on twitter visualization. This social platform indeed offers several opportunities for data visualization: social ties analysis, links between geography and themes/languages, real-time visualization of a particular topic (like a conference), or again to analyse a past topic and its “storyfication”. We spent last week recognizing recent developments related to the topic, identifying three main fields: Real-time visualizations: visualizing twitter stream in realtime during conferences or big events.Visual search: online tools that create a dynamic visual output for a twitter search.Storytelling: the use of visualization to tell an event in the past.
There are both interactive and static examples. We’d like to share with you a selection of these examples. Visual search. Radial Data Visualization in Processing. Visualising Twitter data in Processing 2. Twitter data into processing. Video Background. Fullscreen background (HTML5) video. Untitled. ITP Big Screens Show _ GOEMUL. Kyle McDonald’s Videos on Vimeo. Subdivision of Roam. Night lights. Portrait Machine - Interactive Photography Installation (preview) シャドウプレイ/shadowplay. Video Background. VelocityJS and SVG Moving Isoscape. SVG Low PolyLion: Animated Polygons.
LINQ to Twitter - Documentation. Getting Filtered Statuses Return statuses matching given filters.
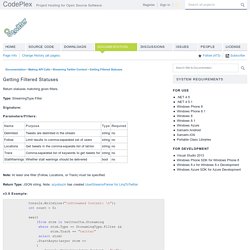
Type: StreamingType.Filter Signature: Parameters/Filters: Note: At least one filter (Follow, Locations, or Track) must be specified. Return Type: JSON string. v3.0 Example: Console.WriteLine("\nStreamed Content: \n"); int count = 0; await (from strm in twitterCtx.Streaming where strm.Type == StreamingType.Filter && strm.Track == "twitter" select strm) .StartAsync(async strm => { Console.WriteLine(strm.Content + "\n"); if (count++ >= 5) strm.CloseStream(); });
Coding. Public Screens Forum. Interactive Canvas. FLUXe is the name of Canada’s largest interactive LED screen installation which is located at Scotia Plaza at the Scotiabank Nuit Blanche.
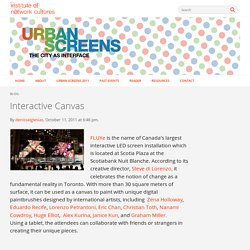
According to its creative director, Steve di Lorenzo, it celebrates the notion of change as a fundamental reality in Toronto. With more than 30 square meters of surface, it can be used as a canvas to paint with unique digital paintbrushes designed by international artists, including Zena Holloway, Eduardo Recife, Lorenzo Petrantoni, Eric Chan, Christian Toth, Nanami Cowdroy, Huge Elliot, Alex Kurina, Janice Kun, and Graham Miller.Using a tablet, the attendees can collaborate with friends or strangers in creating their unique pieces.