
Is Cash for Clunkers Working? National Stereotypes in a word. Google I derived the one-word characterization of each of the nations according to the following rules: 1.
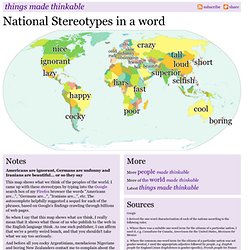
Where there was a suitable one-word term for the citizens of a particular nation, I used it, e.g. Canadians for Canada, Americans for the United States, Mexicans for Mexico 2. Symbolism of Color: Using Color for Meaning. Circumplex Model - iAppSofts.com. Social Networks (2104) People. Gallery. Social Collaboration for Social Business. NVivo Experts - Discover the many ways different researchers, teachers and students put NVivo to work. Big Data Needs Thick Data. Tricia Wang Editor’s Note: Tricia provides an excellent segue between last month’s “Ethnomining” Special Edition and this month’s on “Talking to Companies about Ethnography.”
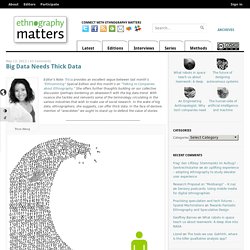
She offers further thoughts building on our collective discussion (perhaps bordering on obsession?) With the big data trend. With nuance she tackles and reinvents some of the terminology circulating in the various industries that wish to make use of social research. In the wake of big data, ethnographers, she suggests, can offer thick data. Image from Mark Smiciklas at Intersection Consulting Big Data can have enormous appeal. Analyze Words. Linguistic Inquiry and Word Count. Words in category refers to the number of different dictionary words that make up the variable category.
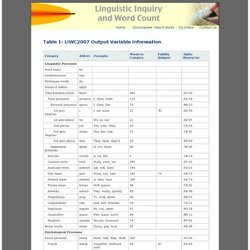
Validity judges reflect the simple correlations between judges' ratings of the category with the LIWC variable (from Pennebaker & Francis, 1996). Alphas refer to the Cronbach alphas for the internal reliability of the specific words within each category. The binary alphas are computed on the occurrence/non-occurrence of each dictionary word whereas the raw or uncorrected alphas are based on the percentage of use of each of the category words within the texts.
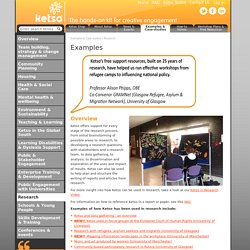
All alphas were computed on a sample of 2800 randomly selected text files from our language corpus. The LIWC dictionary generally arranges categories hierachically. Common verbs are not included in the function word category. Perceptual processes include the entire dictionary of the Qualia category (which is a separate dictionary), which includes multiple sensory and perceptual dimensions associated with the five senses. Discourse Analysis Links. Examples. Overview.
Cytoscape: An Open Source Platform for Complex Network Analysis and Visualization. Socilyzer. Social Network Analysis. Brief Description: "Social network analysis is the mapping and measuring of relationships and flows between people, groups, organisations, computers or other information/knowledge processing entities.
" (Valdis Krebs, 2002). Social Network Analysis (SNA) is a method for visualizing our people and connection power, leading us to identify how we can best interact to share knowledge. A related practice is Network Mapping. PARTNER Tool - Program to Analyze, Record, and Track Networks to Enhance Relationships. Learn how to use Gephi. Welcome to Gephi!
Gephi is an open-source software for visualizing and analysing large networks graphs. Gephi uses a 3D render engine to display graphs in real-time and speed up the exploration. A great free Social Network Analysis Tool. Google Search. Tableau for Students - Free Access to Tableau Desktop. Want to analyze data faster for class assignments?
Gain skills for your first job? Then apply for a free license of Tableau Desktop. Full-time students enrolled at accredited academic institutions anywhere in the world can get a 1-year license of Tableau Desktop. Fill out the form to the right to get started. We’ll verify your student status using data provided by your school. Outlining, Writing, & Brainstorming using Mapping, Graphic Organizers and other Visual Thinking Techniques.
For visual mapping, outlining, writing and making presentations, use Inspiration® 9, the ultimate thinking and learning tool.
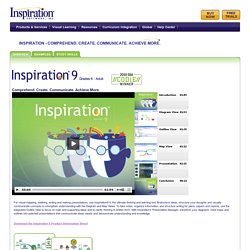
Brainstorm ideas, structure your thoughts and visually communicate concepts to strengthen understanding with the Diagram and Map Views. To take notes, organize information, and structure writing for plans, papers and reports, use the integrated Outline View to focus on main and supporting ideas and to clarify thinking in written form. With Inspiration's Presentation Manager, transform your diagrams, mind maps and outlines into polished presentations that communicate ideas clearly and demonstrate understanding and knowledge. Download the Inspiration 9 Product Information Sheet Visualize & Develop Ideas. ArcGIS - Use Cases. QDA Miner - Qualitative Research Software. What is Qualitative Research?
According to several prominent qualitative scholars (Creswell 2002; Pope & Mays 1995; Denzin & Lincoln, 1994) Qualitative Research is intended to deeply explore, understand and interpret social phenomena within its natural setting. By using a qualitative researcher methodology, researchers want to collect richer information and get more detailed picture of issues, cases or events (Arora and Stoner 2009). They want to explore the why and how of a situation, not only what , where , when . Just like all scientific research, Qualitative Research is a method that seeks answers to questions and involves the collection of evidence.
Perform Qualitative Data Analysis. Itracks. Bring your research to the field… and in the moment… itracks Mobile Discussion Boards offer the ability to fully manage global, qualitative studies from your smartphone or tablet.
Researchers target hard-to-reach population segments and conduct research projects in the field, capturing participant reactions during their experiences. Mobile qualitative expands the opportunities for qualitative research. Software for content analysis and text analysis: Qualitative analysis. Annotations for Mac Mac software to analyse documents by adding and organising highlights, tags or notes on text passages.
ATLAS.ti Computer software for the support of text interpretation, text management and the extraction of conceptual knowledge from documents (theory building); supports the qualitative analysis of large bodies of textual, graphical, audio and video data. Mixed Methods. Innovative Mixed Methods Features from the Mixed Methods Expert Statistics & Graphics Visualize your variables or code occurrences through statistical tables and charts. Statistics und Graphics. What's New in ATLAS.ti 7. There is so much to discover in the new, powerful ATLAS.ti 7, we don't know where to start.
Perhaps we start at the very core: Taking its legendary, central "VISE" principle to a new level, ATLAS.ti 7 can truly be said to be "VISE-r" than ever. Visualize : The margin reloaded: Work with audio and video just as natural as you are used to with text and images. Code Tag Views, integrated frequency bars, a superb new network editor, list previews of documents and analysis items. Software for Qualitative Research – From Content Analysis and Evaluation to Market Research. Qualitative Analysis and Mixed Methods Research Using Dedoose Sign Up.
Qualitative Research Data Analysis Software from Dedoose. Five Sentiment Analysis Tools that Won’t Cost You a Cent. With the rise of social media and Web 2.0, new technologies have paved the way to give the consumer a voice—and a vibrant one to say the least. But who am I to tell you about the power of opinion? You can probably think of that time you bought that “As seen on TV” miracle product that turns out to be, well, a piece of… junk.
I’m sure you just sat there, stared at the mess the company called its product and peacefully shrugged it off, saying to yourself, “Oh well. After all, it’s just money wasted—not a big deal.” Sentiment Analysis and Metrics: Free & Paid Tools – Part 2. Web 2.0: What are consumers saying about your brand? A Twitter Sentiment Analysis Tool. Opinion Crawl - sentiment analysis tool for the Web and social media.
Graphical visualization of text similarities in essays in a book. Early stages in the process While developing the visualization algorithms, we plotted out a lot of different approaches that in the end we discarded for one reason or another. Student Licenses. A Companion to Digital Humanities. The Personal Analytics of My Life. March 8, 2012. Ngram Viewer.