
Online Exhibitions - National Museum of American History. Documenting the American South. GCC Library History Databases. America: History and Life Coverage Range: 1863 - date Includes: Citations & Abstracts · Full Text · Image Resource · MAGAZINE & JOURNAL ARTICLES: Covers the history and culture of the United States and Canada, from prehistory to the present.

Publisher: EBSCOhost U.S. History in Context Includes: Full Text · Primary Sources · MAGAZINE, JOURNAL & ENCYCLOPEDIC ARTICLES: Covers US topics ranging from the arrival of the Vikings in North America to today's war on terror. World History in Context Includes: Full Text · Encyclopedia & Dictionaries · Primary Sources · MAGAZINE, JOURNAL & ENCYCLOPEDIC ARTICLES: Covers world history ranging from the ancient world to today's headlines. Historical Index to the New York Times.
Digital Public Library of America. Discovering The Civil War. Women and Social Movements in the United States, 1600-2000. Civil War Glass Negatives and Related Prints - About this Collection - Prints & Photographs Online Catalog (Library of Congress) All images are digitized | All jpegs/tiffs display outside Library of Congress | View All This online collection provides access to about 7,000 different views and portraits made during the American Civil War (1861-1865) and its immediate aftermath.

The images represent the original glass plate negatives made under the supervision of Mathew Brady and Alexander Gardner as well as the photographic prints in the Civil War photographs file in the Prints & Photographs Reading Room. These negatives and prints are sometimes referred to as the Anthony-Taylor-Rand-Ordway-Eaton Collection to indicate the previous owners. The Library purchased the negatives in 1943. Search tip for this collection: Try putting in very few search terms, particularly when searching for people (for example, try just the person's last name).
Many additional Civil War images are in other collections, including drawings, prints, and photograph albums to name a few. View a slide show of samples. Andrew J. American Rhetoric; kig i "Speech bank" for at finde de enkelte taler. The White House.
Fact-checking U.S. politics. Det Hvide Hus - Obamas Sundhedsreform. Enrolled at HealthCare.gov; paying the same premium but with much better coverage.

From whitehouse.gov Michael, Atlanta, GA Rates dropping from $837 to $432/month; Saving more than $5,000/year on health costs. John, Small business Owner, Atlanta, GA Previously denied coverage due to allergies/asthma. Mary, 57, Los Angeles, CA Enrolled at HealthCare.gov; paying $47/month after taxes (and $15/month for dental) Mick, Full-time student, Dade, FL Previously uninsured due to a preexisting condition; enrolled at HealthCare.gov for $150/month. Noelle, Assistant General Manager, Milwaukee, WI Saving $2,300 a year on her premium alone.
Lucy, Sealy, TX Due to a preexisting condition, he was previously denied coverage. James, 54, Los Angeles Previously turned down for individual coverage. Wealth Inequality in the United States since 1913: Evidence from Capitalized Income Tax Data. NBER Working Paper No. 20625Issued in October 2014NBER Program(s): AG DAE PE This paper combines income tax returns with Flow of Funds data to estimate the distribution of household wealth in the United States since 1913.

We estimate wealth by capitalizing the incomes reported by individual taxpayers, accounting for assets that do not generate taxable income. We successfully test our capitalization method in three micro datasets where we can observe both income and wealth: the Survey of Consumer Finance, linked estate and income tax returns, and foundations' tax records. Wealth concentration has followed a U-shaped evolution over the last 100 years: It was high in the beginning of the twentieth century, fell from 1929 to 1978, and has continuously increased since then. The rise of wealth inequality is almost entirely due to the rise of the top 0.1% wealth share, from 7% in 1979 to 22% in 2012--a level almost as high as in 1929.
Acknowledgments. Obesity Prevalence Maps 2014 - Centers for Disease Control and Prevention. Obesity prevalence in 2014 varies across states and territories.
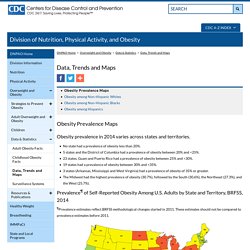
No state had a prevalence of obesity less than 20%. 5 states and the District of Columbia had a prevalence of obesity between 20% and <25%. 23 states, Guam and Puerto Rico had a prevalence of obesity between 25% and <30%. 19 states had a prevalence of obesity between 30% and <35%. 3 states (Arkansas, Mississippi and West Virginia) had a prevalence of obesity of 35% or greater. The Midwest had the highest prevalence of obesity (30.7%), followed by the South (30.6%), the Northeast (27.3%), and the West (25.7%).
Prevalence¶ of Self-Reported Obesity Among U.S. Adults by State and Territory, BRFSS, 2014 ¶Prevalence estimates reflect BRFSS methodological changes started in 2011. Source: Behavorial Risk Factor Surveillance System, CDC. *Sample size <50 or the relative standard error (dividing the standard error by the prevalence) ≥ 30%.