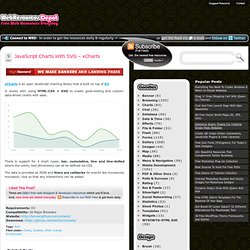

CgSceneGraph. Fabric.js Javascript Canvas Library. JavaScript Charts With SVG – xCharts. xCharts is an open JavaScript charting library that is built on top of D3.

It works with using HTML-CSS + SVG to create good-looking and custom-data-driven charts with ease. There is support for 4 chart types: bar, cumulative, line and line-dotted where the colors, text,dimensions can all be defined via CSS. The data is provided as JSON and there are callbacks for events like mouseover, mouseout, click so that any interactions can be added. BonsaiJS - A Graphics Library. PhiloGL: A WebGL Framework for Data Visualization, Creative Coding and Game Development. A lightweight JavaScript graph drawing library. CHAP Links Library. HTML Canvas Library. jStat : a JavaScript statistical library. Mrdoob/three.js. Javascript Graphics Library jsDraw2D draw line, circle, rectangle, polygon, curve, ellipse. Anvaka/VivaGraphJS - GitHub. 13 Chart and Graph plotting javascript plugins. There are more and more Javascript chart and graph plotting solutions are being released and available for free online.

I work on a complicated graph for a website before, we used highchart as the solution, during that time, there isn't a lot of plugins to choose from, but now, we can easily find many very capable charting libraries. Personally, the rise of this kind of plugins are due to: Flash used to be the best solution, but everyone is moving on from there.Modern browsers and powerful computing make it possible to render live data easily.Maturity of different technologies in drawing vector: VML, SVG and Canvas. Of course, you need to carefully choose one that fit your requirements. As we mentioned before, they use various technologies, as a result, some plugins support canvas only which require modern browsers, and other combine multiple technologies altogether so it able to work on different platforms and older browsers.
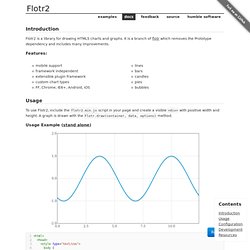
KineticJS - HTML5 Canvas JavaScript Library Framework. Flotr2. Introduction Flotr2 is a library for drawing HTML5 charts and graphs.

It is a branch of flotr which removes the Prototype dependency and includes many improvements. Features: mobile support framework independent extensible plugin framework custom chart types FF, Chrome, IE6+, Android, iOS lines bars candles pies bubbles Usage To use Flotr2, include the flotr2.min.js script in your page and create a visible <div> with positive width and height. Usage Example (stand alone) API: Flotr.draw(container, data, options) container a visible DOM element with positive width and height. Data Each series is either an array of points [[x0, y0], [x1, y1] ...] or an object with series options and a data member.
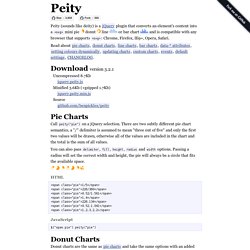
Internet Explorer Flotr2 is fully supported in IE 9+ and explorer canvas or flashcanvas may be conditionally included to support older versions, as seen in the example above. Tquila/jOrgChart - GitHub. d3.js. Progressive <canvas> pie charts. Peity (sounds like deity) is a jQuery plugin that converts an element's content into a <svg> mini pie 2/5 donut 5,2,3 line 5,3,9,6,5,9,7,3,5,2 or bar chart 5,3,9,6,5,9,7,3,5,2 and is compatible with any browser that supports <svg>: Chrome, Firefox, IE9+, Opera, Safari.

Download version 3.2.1 Uncompressed 8.7Kb jquery.peity.js Minified 3.6Kb (+gzipped 1.7Kb) jquery.peity.min.js Source github.com/benpickles/peity Pie Charts Call peity("pie") on a jQuery selection. You can also pass delimiter, fill, height, radius and width options. <span class="pie">1/5</span><span class="pie">226/360</span><span class="pie">0.52/1.561</span><span class="pie">1,4</span><span class="pie">226,134</span><span class="pie">0.52,1.041</span><span class="pie">1,2,3,2,2</span>