
Interaction Design Foundation. Milestones in the History of Thematic Cartography, Statistical Graphics, and Data Visualization. The New Precision Journalism - Chapter 4. 4Computers Most news people and virtually all journalism students today have some familiarity with computers.
Their experience usually starts with word processing, either on a mainframe editing system or on a personal computer. Many learn some other application, such as a spreadsheet or a database. Your mental image of a computer depends very much on the specific things you have done with one. This chapter is designed to invite your attention to a very wide range of possibilities for journalistic applications.
Counting and sorting Bob Kotzbauer was the Akron Beacon Journal's legislative reporter, and I was its Washington correspondent. Back in Akron, we dumped the forms onto a table in the library and sorted them into three stacks: previous Republican voters, Democratic voters, and non-voters. Tottenham riots: Data journalists and social scientists should join forces. In the wake of some of the worst riots in London in more than a decade, Ben Goldacre has said on Twitter: [blackbirdpie id="100156268534181888"] Yes, we’re now going to have to suffer through lots of ill-informed speculation from columnists.
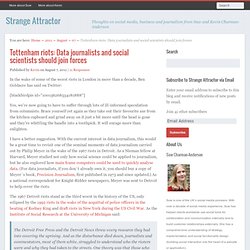
Brace yourself yet again as they take out their favourite axe from the kitchen cupboard and grind away on it just a bit more until the head is gone and they’re whittling the handle into a toothpick. It will enrage more than enlighten. I have a better suggestion. The 1967 Detroit riots stand as the third worst in the history of the US, only eclipsed by the 1992 riots in the wake of the acquittal of police officers in the beating of Rodney King and draft riots in New York during the US Civil War.
The Detroit Free Press and the Detroit News threw every resource they had into covering the uprising. A survey had been done following the 1965 Watts riots. Phil Meyer - Data in the news: From CAR to data journalism. Analytic journalism. Michelle Minkoff » Bringing data journalism into curricula. As a recently graduated Medillian (yay for entering the “real world, boo for having to leave such a nurturing and wonderful place), I’ve been thinking a lot about data journalism and my generation.
Why were there so few students at NICAR? Yes, it costs money to get to a conference, but I’m not even seeing all that many on NICAR-L. Perhaps it’s not as snazzy or attractive as video or Flash, but I maintain that the Web cries out for data, and with the right mentality, it’s even more interesting than these other journalism subsets. Data journalism ought to be something every journalist is familiar with, and at least considers as a possible specialization. I think part of the issue is that it’s just not being taught as well as it could be in journalism schools. But schools are there to help you, you shouldn’t have to seek everything out for yourself. The growing importance of data journalism. One of the themes from News Foo that continues to resonate with me is the importance of data journalism.
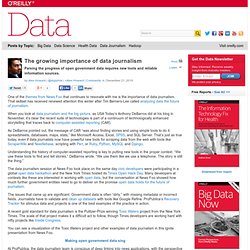
That skillset has received renewed attention this winter after Tim Berners-Lee called analyzing data the future of journalism. When you look at data journalism and the big picture, as USA Today’s Anthony DeBarros did at his blog in November, it’s clear the recent suite of technologies is part of a continuum of technologically enhanced storytelling that traces back to computer-assisted reporting (CAR). As DeBarros pointed out, the message of CAR “was about finding stories and using simple tools to do it: spreadsheets, databases, maps, stats,” like Microsoft Access, Excel, SPSS, and SQL Server.
社会化媒体、移动终端、大数据:影响新闻生产的新技术因素_newspenglan. (本文将发表于《新闻界》杂志 2012第8期) 今天的传媒业面临的技术冲击,是前所未有的。

Portfolio - Marije Rooze. Open data journalism, shorter presentation by Simon Rogers on Prezi. FUTURE OF JOURNALISM. Mirko Lorenz’s Presentations on SlideShare. Data-driven journalism: What is there to learn? (Stanford, June 201... Visual storytelling: 14 tools for journalists. Credit: Image by TapiF on Flickr.
Some rights reserved Over the past year here at Journalism.co.uk we have reported on a number of new tools and platforms which have been launched or updated, which offer journalists different ways of telling stories visually. Our news:rewired events have also highlighted a number of those tools, most recently in a dedicated session on visual storytelling at news:rewired - digital stories, which was held last Thursday (6 December). Here is a list of just 14 tools that journalists might find useful. Some launched this year, while others have been around for some time now but continue to be used by news outlets today. Timelines 1. Users simply sign up to Timetoast and then they can create embeddable timelines. Each event added to the timeline can have an image and link added to it. 2. Another timeline building option is Dipity, which users also sign up to use, either directly through Dipity or via Facebook. Some Data Journalism Resources. Data driven journalism. Data-driven journalism, often shortened to "ddj", is a term in use since 2009/2010, to describe a journalistic process based on analyzing and filtering large data sets for the purpose of creating a news story.
Main drivers for this process are newly available resources such as "open source" software and "open data". This approach to journalism builds on older practices, most notably on CAR (acronym for "computer-assisted reporting") a label used mainly in the US for decades. Data Driven Journalism. The Gory Details Of Datajournalism: what went wrong and who was res...
Media Companies Must Become Trusted Data Hubs. This article was written by Mirko Lorenz, information architect (Cologne, Germany), Nicolas Kayser-Bril, head datajournalist at OWNI (Paris, France), and Geoff McGhee, online journalist who created Journalism in the Age of Data (Stanford).
It was started by a tweet from @mirkolorenz which led up, 20 days later, to this piece which aims at inspiring media companies, showing new editorial and business opportunities. Journalists and media companies in general have had to answer a fundamental question ever since their traditional business model collapsed: What are we? In the old days, it was easy. Media barons could see themselves as selling attention to advertisers, while journalists could see themselves as holding the powers that be to account, free of all business-related interference. And in those days, everybody was right. Today, the two branches of the business have split, possibly forever. Everything is data. Voices: News organizations must become hubs of trusted data in a market seeking (and valuing) trust. Editor’s Note: American readers may know Geoff McGhee for his video project Journalism in the Age of Data, released to acclaim last fall.
Here he teams up with two European colleagues — Mirko Lorenz, a German information architect and journalist, and Nicolas Kayser-Bril, head data journalist at OWNI in France — to argue that news organizations should restructure themselves as data generators, gatherers, and analyzers. They believe that selling trusted data should be the foundation of journalism’s new business model.
Give their argument a look. Journalists and media companies in general have had to answer a fundamental question ever since their traditional business model collapsed: What are we? In the old days, it was easy. Today, the two branches of the business have split, possibly forever. Those who prefer to run Google AdWords next to user-generated product reviews have made their choice: They’ve left the journalism business. Crowdsourcing: how to find a crowd (Presented at ARD/ZDF Academy in... #ijf11: Lessons in data journalism from the New York Times. Follow this link or scroll to the bottom to start by hearing more from New York Times graphics editor Matthew Ericson on what kind of people make up his team and how they go about working on a story The New York Times has one of the largest, most advanced graphics teams of any national newspaper in the world.
Yesterday at the International Journalism Festival, NYT deputy graphics editor Matthew Ericson led an in-depth two-hour workshop on his team’s approach to visualising some of the data that flows through the paper’s stories every day. He broke the team’s strategy down in to a few key objectives, the four main ones being: Provide contextDescribe processesReveal patternsExplain the geography Here is some of what Ericson told the audience and some of the examples he gave during the session, broken down under the different headers.
Provide context Graphics should bring something new to the story, not just repeat the information in the lede. Describe processes From nuclear meltdown to dancing. Using Data Visualization as a Reporting Tool Can Reveal Story’s Shape. Readers have come to rely on interactive presentations to understand complicated stories, using them to zoom in on periods of time and highlight areas of interest. Yet to investigate these stories, reporters often create what amounts to handcrafted investigative art: flow charts with circles and arrows, maps shaded with highlighters and stuck with pins. More and more, though, some reporters are using data visualization tools to find the story hidden in the data.
Those tools help them discover patterns and focus their reporting on particular places and times. Many of the presentations, which can have rough interfaces or less-than-sleek design, are never published. At the recent National Institute for Computer-Assisted Reporting (NICAR) conference, Sarah Cohen, database editor for The Washington Post‘s investigative team — and recently named professor of computational journalism at Duke University — showed how reporters can use interactive graphics for their exploratory reporting. Breaking new ground at the intersection of technology, design and story-telling. #PDFTribute list of documents. Journalism in the Age of Data: A Video Report on Data Visualization by Geoff McGhee.
Apply – Journalism Fellowship – Google. About this website. We are a hub for news and resources from the community of journalists, editors, designers and developers who use data in the service of journalism. On our site you’ll be able to: Get a behind the scenes look at data journalism projects from around the world;Learn about new tools and methods for how to work with data effectively;Find out and get informed about training events and job opportunities in your area;Stay on top of the latest developments in the field.
The website is part of the European Journalism Centre’s Data Driven Journalism initiative. Data Driven Journalism is one of the leading initiatives for training, resources and networking in the area of data journalism. Founded in 2010, the programme is dedicated to accelerating the diffusion and improving the quality of data journalism around the world, whether the focus is on investigations, news applications, putting news into context, or simply using data to inform and assist journalistic work. Other Projects We Run The Team. Data Journalism Blog - Get the latest news on data driven journalism with interviews, reviews and news features.
Datenjournalismus: OpenDataCity. Homepage - European Journalism Centre.