
ENVS456: Web mapping and analysis. Introducing Mapbox Studio. Today we're inviting everyone with a Mapbox account to create amazing cartography and advanced visualizations with Mapbox Studio.
This is a turning point: a system for cartography that's powerful but easy to use and produces maps optimized for mobile applications and the modern web. Mapbox Studio is the axis of Mapbox's ecosystem: every style is optimized for use with our mobile & web SDKs and ready to be extended with our APIs for developers, like geocoding and directions. Create styles, see your statistics, upload custom data, and manage API access all through one integrated, user-friendly interface. GeoHive - Spatial data made easy. Spring Roo based RAD tool for Java developers – gvNIX. Open Web Mapping: How do we teach this stuff? Javier de la Torre: "There are a ton of European geo-startups trying to conquer the world" Javier de la Torre is the CEO of CartoDB, a global startup democratizing data analysis and visualization on maps. He is a former scientist with a research focus on biodiversity informatics and global environmental change, and is a recognized expert on open data, open source software, and data visualization.
Q: I have the impression many users of CartoDB are people who wouldn’t otherwise have the technical ability or skills to bring a map to life. Who uses it? GvNIX, Spring Roo based RAD tool for Java developers – gvNIX. GvNIX is an open source tool for rapid application development (RAD) with which you can create Java web applications in minutes.
It is a distribution of Spring Roo that provides the set of Spring Roo tools plus a suite of features that increase development productivity and improve the user experience by integrating frameworks like jQuery, Bootstrap 3, Leaflet, DataTables, Dandelion DataTables, among other. gvNIX = productivity Create web applications in minutes. Authentification Sésame Rennes 2. CartoDB at the MWC - The Next Generation Mapping platform will be Open Source — CartoDB Blog. From March 2-5, we will be at the Mobile World Congress in Barcelona showcasing our latest developments in geospatial platforms and other mapping technologies.

The CartoDB team will be ready to engage in and demonstrate the use and efficacy of location-based services and maps—a considerable part of the mobile experience. Apart from learning about CartoDB, don’t miss ‘The Next Generation Mapping platform will be Open Source,’ a panel we are hosting with some of the most influential people in the mapping industry. The panel will be on March 4 at 3:30 p.m. in the presentation area of the Spanish Pavilion (Congress Square CS60). In the mobile industry, location and mapping are key features; location- based services and location analytics are becoming increasingly central to business intelligence. Workshop: Introduction to Mapping.
Taught by Francesca Giannetti, Digital Humanities Librarian, Alexander Library Wednesday, December 10, 2014 4:00 – 6:00 PM Alexander Library, Room 415 169 College Avenue, New Brunswick, NJ Have you been wanting to explore a geographic component to your research but don’t know how to get started?
Attend this workshop, and you will learn the basics of geospatial analysis, including file types, the csv data format – one of the most ubiquitous and application agnostic, how to create vector data (points, lines, polygons), finding and reusing geospatial data, examples of how to visualize your data, and how to share interactive digital maps online. Comment nous avons enquêté avec les données d'Airbnb. Demain et dès à présent sur le site web du Temps, vous pourrez lire une enquête de notre journaliste Julie Conti sur Airbnb à Genève.
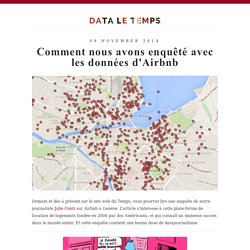
L’article s’intéresse à cette plate-forme de location de logements fondée en 2008 par des Américains, et qui connaît un immense succès dans le monde entier. Et cette enquête contient une bonne dose de datajournalisme. Du journalisme de données Tout est parti d’une question. Dans de nombreuses grandes villes - Paris, New-York, Berlin - Airbnb est accusé de confisquer le marché locatif. GEOG 585: Open Web Mapping. Georeferencing imagery. You can place a scanned aerial image or a historical map onto a Mapbox map with spatial referencing.
Below, we go over the steps of how to take a non-georeferenced JPEG image and turn it into a geospatial dataset ready for rendering in Mapbox Studio and other Mapbox tools. Here, we use the free and open-source application Quantum GIS (version 2.4) and a couple plugins to georeference an image onto a map. We’ll then save the image and upload it to Mapbox. Load QGIS plugins. The Map Academy › CartoDB.js. What you’ll learn This introduction to CartoDB.js from the ground up will take you through the common uses of the library.
You'll start out by pulling your maps from CartoDB with only a few lines of code. Later you'll customize your maps with JavaScript, interact with the data, add custom SQL queries, integrating other features, and much more. Prerequesites Experience creating multi-layer visualizations in CartoDB Some experience coding in HTML and JavaScript Reliable internet access A modern browser like Chrome, Firefox, or Safari A desire to learn! In the classroom, now unlimited — CartoDB Blog. Cartodb/README.md at master · CartoDB/cartodb. Using OpenLayers 3 with Ember.js. Last week we announced the release of OpenLayers 3 Beta 2, so this week I wanted to share some recent experiments combining OpenLayers 3 and Ember.js to create a LayerSwitcher that supports grouping and overlays as well as base layers.
This was my first attempt to use Ember.js, an open-source client-side JavaScript web application framework based on the model-view-controller (MVC) software architecture pattern. It uses the Handlebars library for its templates. Some of my takeaways from this exercise were: Ember seems powerful, and easy to learn. Odyssey.js. Los mejores plugins para Leaflet. Better Maps For IOS: Introducing Mapbox GL - Splash. Google to Mapbox. Are you using Google Maps and searching for the equivalent code in the Mapbox JavaScript API?
This guide walks you through examples in the Google Maps API v3 and their implementation in mapbox.js. Getting started To begin, you’ll need the latest version of mapbox.js. Unlike Google, there’s no API key required when you include the script in your HTML. Just link directly to a hosted version by copying this snippet into the header of your HTML document.
Scribeui 0.7 beta. Map of the Week: Doughnut Holes in international waters. We welcome Dmitriy Skougarevskiy who is a doctoral candidate at The Graduate Institute of International and Development Studies in this guest post to let him tell us about his pet project on the loopholes in the Law of the Sea, called donutholes.ch.
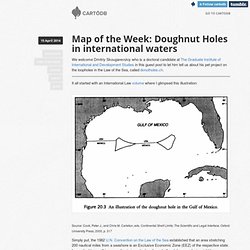
It all started with an International Law volume where I glimpsed this illustration: Simply put, the 1982 U.N. Convention on the Law of the Sea established that an area stretching 200 nautical miles from a seashore is an Exclusive Economic Zone (EEZ) of the respective state. Online GIS - Meet The Cloud Publication Platforms That Will Revolutionize Our Industry » Videos » Social GIS Professional Networking Community. Login ID: Password: Forgot your password? Sign Up GeoMeeting Social Networking Community helps you connect and share with the people in your life. Online GIS - Meet the Cloud Publication Platforms that Will Revolutionize our Industry. SharpMap - Geospatial Application Framework for the CLR - Home. The Insanely Illustrated Guide To Your First Data-Driven TileMill Map.
TileMill is a free-to-download application for Windows and the Mac that will let you build beautiful, data driven maps. If the bland sameness of Google maps is giving you ennui, TileMill might be a good alternative for you. Autopsie d’une dataviz [5.2] : des MBTiles pour éviter les tuiles. Expanding Leaflet's format support with Omnivore. Omnivore helps Mapbox.js & Leaflet eat more types of data. We love and support GeoJSON, but sometimes specific data is in other formats, like GPX from a running watch, KML from Google Earth, CSVs from your spreadsheets, or TopoJSON files with enhanced geometries. Omnivore makes it all super-simple: omnivore.gpx('run.gpx').addTo(map); SIG Web ou GéoCloud ? Quelques réflexions personnelles...
Il y a près de 20 ans, avec l'avènement de l'Internet et sa généralisation dans la société civile comme dans le monde professionnel, est apparue la notion de SIG Web. Il était alors question pour certains des acteurs historiques de la géomatique (les traditionnels éditeurs de SIG lourds travaillant sur stations de travail, Mac et PC) de s'adapter à cette nouvelle technologie, plus moderne, plus puissante, plus souple et plus tendance.
D'autres n'y ayant pas cru, n'ont pas pris ce virage. On en reparlera... A Simple Map. Open source mapping software in the cloud. To make it easy for you to get started with open source mapping software on own server, we provide server images including everything you need: PostGIS, MapServer, TileCache, GDAL, WFS, WMS, Elasticsearch, Leaflet and OpenLayers. Just launch an instance and start uploading your spatial data in only 5 minutes. After launch no configuration is needed, just start using your server and share maps with the world. Configuration of the servers: Ubuntu 12.04LTS (64 bit) running Apache2 as Worker MPM.PHP5.3 is running as FPM (a FastCGI implementation).The tile cache running as a mod_python application.Oracle JDK We’ve also put a basic GeoServer install on the images. You can quickly get a full GC2 server up and running on your own server by using our virtual machine image.
Maps and narratives for dense urban spaces. Leaflet. TileMill. Showing GPS tracks in 3D with three.js and d3.js. Le Web - Future of the Interface and The Internet of Things. Des cartes avec GeoDjango et Leaflet. Une brève introduction au Web mapping avec Django, en utilisant deux applications développées par Makina Corpus: django-leaflet et django-geojson.
Nous allons construire une carte avec les stations métérologiques du monde. Une station météo Chaque station a un identifiant, un nom et une position. En GeoDjango, le modèle donne ça : Lecture Notes - History of Web Mapping. What's new with JavaScript and geospatial - wrapup from the js.geo event. Summary: A Brief History of Web Mapping.