
Diagram. A diagram is a two-dimensional geometric symbolic representation of information according to some visualization technique.
Sometimes, the technique uses a three-dimensional visualization which is then projected onto the two-dimensional surface. The word graph is sometimes used as a synonym for diagram. Overview[edit] The term diagram in common sense can have a general or specific meaning: In the specific sense diagrams and charts contrast computer graphics, technical illustrations, infographics, maps, and technical drawings, by showing "abstract rather than literal representations of information".[1] The essences of a diagram can be seen as:[1] a form of visual formatting devicesa display that do not show quantitative data or [numerical], but rather relationships and abstract informationwith building blocks such as geometrical shapes connected by lines, arrows, or other visual links.
Diagrammatic Reasoning. Diagrammatic reasoning is reasoning by means of visual representations.
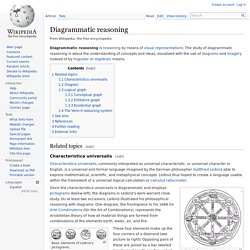
The study of diagrammatic reasoning is about the understanding of concepts and ideas, visualized with the use of diagrams and imagery instead of by linguistic or algebraic means. Related topics[edit] Characteristica universalis[edit] Characteristica universalis, commonly interpreted as universal characteristic, or universal character in English, is a universal and formal language imagined by the German philosopher Gottfried Leibniz able to express mathematical, scientific, and metaphysical concepts. Leibniz thus hoped to create a language usable within the framework of a universal logical calculation or calculus ratiocinator.
Leibniz's diagrammatic reasoning. Since the characteristica universalis is diagrammatic and employs pictograms (below left), the diagrams in Leibniz's work warrant close study. Visual Reasoning. Ferguson argues that non-verbal (largely visual) reasoning does not get much attention in areas like history of technology and philosophy of science because the people involved are verbal rather than visual thinkers.
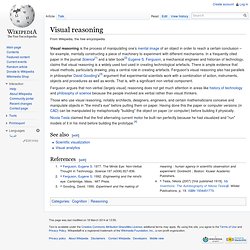
Those who use visual reasoning, notably architects, designers, engineers, and certain mathematicians conceive and manipulate objects in "the mind's eye" before putting them on paper. Having done this the paper or computer versions (in CAD) can be manipulated by metaphorically "building" the object on paper (or computer) before building it physically. Nicola Tesla claimed that the first alternating current motor he built ran perfectly because he had visualized and "run" models of it in his mind before building the prototype.[4]
Deployment Flowchart. A deployment flowchart (sometimes referred to as a "cross functional flowchart") is a business process mapping tool used to articulate the steps and stakeholders of a given process.
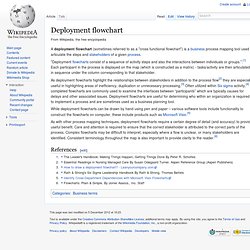
"Deployment flowcharts consist of a sequence of activity steps and also the interactions between individuals or groups. ".[1] Each participant in the process is displayed on the map (which is constructed as a matrix) - tasks/activity are then articulated in sequence under the column corresponding to that stakeholder. As deployment flowcharts highlight the relationships between stakeholders in addition to the process flow[2] they are especially useful in highlighting areas of inefficiency, duplication or unnecessary processing.[3] Often utilized within Six sigma activity,[4] completed flowcharts are commonly used to examine the interfaces between “participants” which are typically causes for delays and other associated issues.
Control-Flow. This article is about flow diagrams in business process modeling[clarification needed].
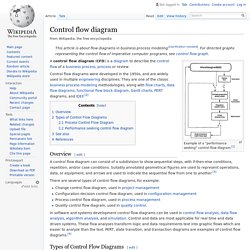
For directed graphs representing the control flow of imperative computer programs, see control flow graph. Example of a "performance seeking" control flow diagram.[1] Control flow diagrams were developed in the 1950s, and are widely used in multiple engineering disciplines. Circuit. Circuit (Note) Block. Block diagram is a diagram of a system in which the principal parts or functions are represented by blocks connected by lines that show the relationships of the blocks.[1] They are heavily used in the engineering world in hardware design, electronic design, software design, and process flow diagrams.
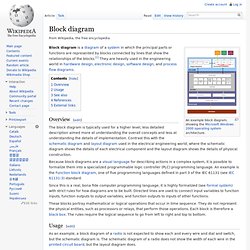
Overview[edit] The block diagram is typically used for a higher level, less detailed description aimed more at understanding the overall concepts and less at understanding the details of implementation. Ishikawa. Ishikawa diagrams (also called fishbone diagrams, herringbone diagrams, cause-and-effect diagrams, or Fishikawa) are causal diagrams created by Kaoru Ishikawa (1968) that show the causes of a specific event.[1][2] Common uses of the Ishikawa diagram are product design and quality defect prevention, to identify potential factors causing an overall effect.

Each cause or reason for imperfection is a source of variation. Causes are usually grouped into major categories to identify these sources of variation. The categories typically include: OBASHI. The OBASHI methodology provides a framework and method for capturing, illustrating and modeling the relationships, dependencies and dataflows between business and Information technology (IT) assets and resources in a business context.
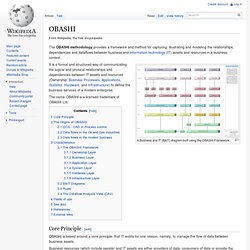
A Business and IT (B&IT) diagram built using the OBASHI Framework. It is a formal and structured way of communicating the logical and physical relationships and dependencies between IT assets and resources (Ownership, Business Processes, Applications, Systems, Hardware, and Infrastructure) to define the business services of a modern enterprise. The name OBASHI is a licensed trademark of OBASHI Ltd.
Core Principle[edit] OBASHI is based around a core principle: that IT exists for one reason, namely, to manage the flow of data between business assets. Activity. Activity diagrams are graphical representations of workflows of stepwise activities and actions[1] with support for choice, iteration and concurrency.
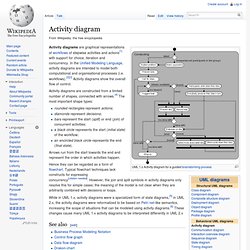
In the Unified Modeling Language, activity diagrams are intended to model both computational and organisational processes (i.e. workflows).[2][3] Activity diagrams show the overall flow of control. Activity diagrams are constructed from a limited number of shapes, connected with arrows.[4] The most important shape types: rounded rectangles represent actions;diamonds represent decisions;bars represent the start (split) or end (join) of concurrent activities;a black circle represents the start (initial state) of the workflow;an encircled black circle represents the end (final state).
Arrows run from the start towards the end and represent the order in which activities happen. Concept map. An Electricity Concept Map, an example of a concept map A concept map or conceptual diagram is a diagram that depicts suggested relationships between concepts.[1] It is a graphical tool that designers, engineers, technical writers, and others use to organize and structure knowledge.

A concept map typically represents ideas and information as boxes or circles, which it connects with labeled arrows in a downward-branching hierarchical structure. The relationship between concepts can be articulated in linking phrases such as causes, requires, or contributes to.[2] Flowchart. A simple flowchart representing a process for dealing with a non-functioning lamp. Mind map. Infographic. Information graphics or infographics are graphic visual representations of information, data or knowledge intended to present complex information quickly and clearly.[1][2] They can improve cognition by utilizing graphics to enhance the human visual system’s ability to see patterns and trends.[3][4] The process of creating infographics can be referred to as data visualization, information design, or information architecture.[2] Overview[edit] Infographics have been around for many years and recently the proliferation of a number of easy-to-use, free tools have made the creation of infographics available to a large segment of the population.
Social media sites such as Facebook and Twitter have also allowed for individual infographics to be spread among many people around the world. In newspapers, infographics are commonly used to show the weather, as well as maps, site plans, and graphs for statistical data. "Graphical displays should: Graphics reveal data.