

Creator. Processing ...

Personal $ Svg $20 ✓ Up to $75 merchandises for personal use. Merchandise $ License to use artwork in merchandises (T-Shirt, Mug, poster, etc). Single Use $ License for single-purpose non-merchandising use. Unlimited $ Unlimited personal or commercial use. Custom $TBD Custom license, with terms subject to prior arrangement.
Please contact licensing@tagxedo.com for more information By accepting this license, you agree to the Tagxedo's Terms of Service, and you agree that you have acquired the right to use the source image to create the Tagxedo artwork, and that you indemnify and hold harmless Tagxedo and its employees and officers from any harm are liability that may incur. Please contact licensing@tagxedo.com if you have any question. 9 Word Cloud Generators That Aren't Wordle. The use of word clouds in the classroom is a powerful way to really get through to visual learners.
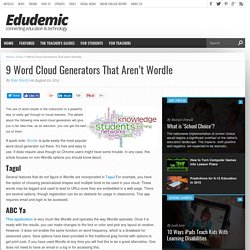
The details about the following nine word cloud generators will give you a fair idea how, as an educator, you can get the best out of them. A quick note: Wordle is quite easily the most popular word cloud generator out there. Open source HTML5 Charts for your website. 2013 – The Winners. We’ve been through hell and high water to bring you the best and brightest of the data viz world in 2013 for the Kantar Information is Beautiful Awards.

Many hours of cogitation, digestion and deliberation have been spent and now here they are, all of our glorious winners on one uber-long scrolling page. Congratulations to all our winners. Now sit back and marvel! Browse the showcase to see all the entires and the gold, silver and bronze winners. Information is Beautiful Awards. 7 Ways To Make A Google Map Using Google Spreadsheet Data. If you maintain a lot of data in Google Spreadsheet, you’ve probably at least once thought, “Hey, I should be able to get all those locations and quickly plot them in a Google Map”.
Well, you can of course. But doing this is not quite as obvious as you might expect. With Google writing both the spreadsheet and the map-making software, there should be several easy ways to do this. You’d expect to see a File > Export as Map option or a File > Download as KML. PUFF PUFF Project. Map Gallery — CartoDB. Datable. Data Visualization Libraries Based on D3.JS - Mike McDearmon.
There are a lot of ways to visualize data on the Web (with more emerging every day), but the flexibility, versatility, and energized development community surrounding D3.js makes it a great option to explore.
The following list of D3 plugins, extensions, and applications below is by no means comprehensive, but oughta be enough to keep you busy for a while. If you’re just getting your feet wet with D3.js, here are some great learning resources to get you acclimated:D3 for mere mortals: Great introductory lessons for those starting from scratch.Try D3 Now: Another great resource for learning about core D3 concepts.Data-Driven Documents (paper): An academic article by Mike Bostock with loads of footnotes.Learning D3, Scott Becker: A quick and effective tutorial series to get yourself up and running.Dashing D3: A very thorough tutorial series covering a LOT more than just D3.Interactive Data Visualization for the Web is a fantastic book by Scott Murray. Hypercube Projections. Expo2015 Theme Visualization.
Timeline. Timeline JS - Beautifully crafted timelines that are easy, and intuitive to use. Dimple - A simple charting API for d3 data visualisations. The Asia Foundation: The Contested Corners of Asia: A Visual Companion. Gallery · mbostock/d3 Wiki. Wiki ▸ Gallery Welcome to the D3 gallery!
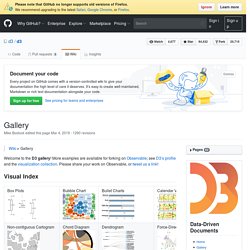
More examples are available for forking on Observable; see D3’s profile and the visualization collection. Please share your work on Observable, or tweet us a link! Visual Index Basic Charts Techniques, Interaction & Animation Maps Statistics Examples Collections The New York Times visualizations Jerome Cukier Jason Davies Jim Vallandingham Institute for Health Metrics and Evaluation Peter Cook Charts and Chart Components Bar Chart Histogram Pareto Chart Line and Area Chart Pie Chart Scatterplot and Bubble chart Parallel Coordinates, Parallel sets and Sankey Sunburst and Partition layout Force Layout Tree Misc Trees and Graphs Chord Layout (Circular Network) Maps Misc Charts Miscellaneous visualizations Charts using the reusable API Useful snippets Tools.
東京風速. Concept map. Epicyclic Gearing. Video tutorial about d3.js for visualization. I'm probably very late on this, so don't laugh at me if you knew about it already.
For the past couple of days I've been watching a long (20 video clips!) Introduction to d3.js, Mike Bostock's Javascript library for interactive data visualization. The videos were uploaded to YouTube 10 months ago by someone called d3vienno. I tried to track him down. I sent him an e-mail and did a Google search that returned several results, none of them very helpful.
In case you're planning to get started with d3.js, I'd recommend that you first learn some HTML, CSS, and Javascript.