
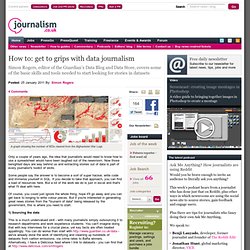
Datajournalisme. Data jounalism. How to: get to grips with data journalism. A graph showing the number of IEDs cleared from the Afghanistan War Logs Only a couple of years ago, the idea that journalists would need to know how to use a spreadsheet would have been laughed out of the newsroom.
Now those benighted days are way behind us and extracting stories out of data is part of every journalist's toolkit of skills. Some people say the answer is to become a sort of super hacker, write code and immerse yourself in SQL. If you decide to take that approach, you can find a load of resources here. But a lot of the work we do is just in excel and that's what I'll deal with here.
Of course, you could just ignore the whole thing, hope it'll go away and you can get back to longing to write colour pieces. 1) Sourcing the data This is a much undervalued skill - with many journalists simply outsourcing it to research departments and work experience students. But broadly, the general approach is to look for the most authoritative place for your data. 3) Keep the codes. Newspapers. Data journalism and data visualization from the Datablog.
How to be a data journalist. Data journalism is huge.
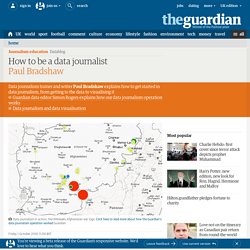
I don't mean 'huge' as in fashionable - although it has become that in recent months - but 'huge' as in 'incomprehensibly enormous'. It represents the convergence of a number of fields which are significant in their own right - from investigative research and statistics to design and programming. The idea of combining those skills to tell important stories is powerful - but also intimidating. Who can do all that? The reality is that almost no one is doing all of that, but there are enough different parts of the puzzle for people to easily get involved in, and go from there. 1. 'Finding data' can involve anything from having expert knowledge and contacts to being able to use computer assisted reporting skills or, for some, specific technical skills such as MySQL or Python to gather the data for you.
Guardian. Journalism Needs Data in 21st Century. Journalism has always been about reporting facts and assertions and making sense of world affairs.
No news there. But as we move further into the 21st century, we will have to increasingly rely on "data" to feed our stories, to the point that "data-driven reporting" becomes second nature to journalists. The shift from facts to data is subtle and makes perfect sense. You could that say data are facts, with the difference that they can be computed, analyzed, and made use of in a more abstract way, especially by a computer.
CartoCrime.Net. Journalism in the Age of Data: A Video Report on Data Visualization by Geoff McGhee. Data journalism pt2: Interrogating data. This is a draft from a book chapter on data journalism (the first, on gathering data, is here). I’d really appreciate any additions or comments you can make – particularly around ways of spotting stories in data, and mistakes to avoid. UPDATE: It has now been published in The Online Journalism Handbook. “One of the most important (and least technical) skills in understanding data is asking good questions. An appropriate question shares an interest you have in the data, tries to convey it to others, and is curiosity-oriented rather than math-oriented. Visualizing data is just like any other type of communication: success is defined by your audience’s ability to pick up on, and be excited about, your insight.”
Once you have the data you need to see if there is a story buried within it. The first stage in this process, then, is making sure the data is in the right format to be interrogated. Insert: Cleaning up data Some tips for cleaning your data include: Like this: Like Loading...