
Venngage. Create and share visual ideas online. FreeDive - API de recherche dans base de données. Ushahidi. Timetric. Development Seed. DataWrapper. Rewire the web. Chartool.
Infogr.am. Gephi. Tableau Public. IMPURE. Tuto Impure. Impure is a new programming language designed to give non-programmers access to professional tools for data visualization.

Users can use it to process and display data from social media feeds, financial information and more. Unlike Processing, a simple programming language for data visualization and art, Impure is a completely visual language - there's no need to learn any code. The programming language is also completely web hosted - there is no development environment to install. It's sort of like Yahoo! Pipes but for visualization. Above is a sceenshot of Impure being used to process a Twitter feed.
Although it's targeted at non-programmers, some basic programming knowledge would clearly be useful. Given the data deluge that many enterprise face, easy tools for data visualization should be in high demand - especially in areas like social monitoring. For some background on the joys of data visualization, check out this TED talk. Tutorials for Fusion Tables. Create with Fusion Tables These tutorials step you through using Fusion Tables’ features to accomplish neat things with your data.
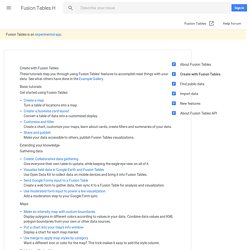
See what others have done in the Example Gallery. Basic tutorials Get started using Fusion Tables: Create a map Turn a table of locations into a map. Extending your knowledge Gathering data Create: Collaborative data gathering Give everyone their own table to update, while keeping the eagle-eye view on all of it. Maps. Comment faire un Google Motion Chart. Google Motion Chart est un outil puissant et simple d'utilisation qui permet d'interroger facilement un grand nombre de points de données.

Voici en quelques étapes simples comment réaliser le sien. Faire parler des tableaux de données, c’est pas facile. On peut les décrire à la main, mais c’est long et fastidieux. On peut en faire des visualisations, mais ça coûte cher en design. Il existe une solution idéale, le Google Motion Chart, inspiré de GapMinder. OWNI l’a testé pour expliquer les causes de la crise grecque. Tutoriel par l’exemple : Tentons d’expliquer pourquoi un pays émet du CO2. 1. Trouvez une base de données. Sélectionnez les séries de données qui vous paraissent pertinentes. 2. Pour pouvoir travailler proprement, il disposer de données homogènes. On va ici se limiter à analyser les 27 pays de l’UE de 1990 à 2007. Les onglets AI et CA donnent accès à des données plus détaillées. 3. Mettez à jour le tableau et exportez. Exportez dans Microsoft Excel.