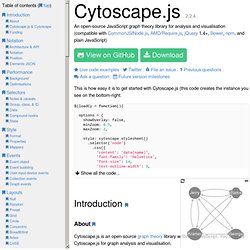
JavaScript InfoVis Toolkit. Cytoscape.js. This is how easy it is to get started with Cytoscape.js (this code creates the instance you see on the bottom-right: About Cytoscape.js is an open-source graph theory library written in JavaScript. You can use Cytoscape.js for graph analysis and visualisation. Cytoscape.js allows you to easily display and manipulate rich, interactive graphs. Because Cytoscape.js allows the user to interact with the graph and the library allows the client to hook into user events, Cytoscape.js is easily integrated into your webapp, especially since Cytoscape.js supports both desktop browsers, like Chrome, and mobile browsers, like on the iPad.
Cytoscape.js includes all the gestures you would expect out-of-the-box, including pinch-to-zoom, box selection, panning, et cetera. Cytoscape.js also has graph analysis in mind: The library contains a slew of useful functions in graph theory. Cytoscape.js is an open-source project, and anyone is free to contribute. Cytoscape.js & Cytoscape Funding Architecture & API Data. Cytoscape Web. Sigma js. D3.js - Data-Driven Documents.