
S4usM8v.jpg (700×630) AhOjLz8.gif (800×8848) SRPNXW6.gif (225×300) Bode Plot Examples. Several examples of the construction of Bode Plots are included in this file.
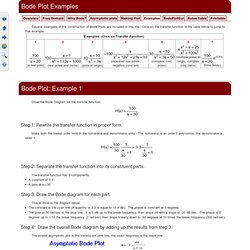
Click on the transfer function in the table below to jump to that example. Bode plot. Figure 1(a): The Bode plot for a first-order (one-pole) highpass filter; the straight-line approximations are labeled "Bode pole"; phase varies from 90° at low frequencies (due to the contribution of the numerator, which is 90° at all frequencies) to 0° at high frequencies (where the phase contribution of the denominator is −90° and cancels the contribution of the numerator).
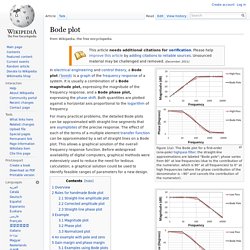
Figure 1(b): The Bode plot for a first-order (one-pole) lowpass filter; the straight-line approximations are labeled "Bode pole"; phase is 90° lower than for Figure 1(a) because the phase contribution of the numerator is 0° at all frequencies. For many practical problems, the detailed Bode plots can be approximated with straight-line segments that are asymptotes of the precise response. The effect of each of the terms of a multiple element transfer function can be approximated by a set of straight lines on a Bode plot. This allows a graphical solution of the overall frequency response function. Overview[edit] where or. Www-inst.eecs.berkeley.edu/~ee40/su06/lectures/Bode_Plots.pdf. Mechanical Engineering. Courses. Test for greater than - MATLAB. Syntax Description example A > B returns a logical array with elements set to logical 1 (true) where A is greater than B; otherwise, it returns logical 0 (false).

The test compares only the real part of numeric arrays. gt returns logical 0 (false) where A or B have NaN or undefined categorical elements. gt(A,B) is an alternate way to execute A > B, but is rarely used. Examples Test Vector Elements Determine if vector elements are greater than a given value. Create a numeric vector. Test the vector for elements that are greater than 10. ans = 0 1 1 0 0 1 0 1. ??? Undefined function or method 'In' for input arguments of type 'char'. - MATLAB Answers - MATLAB Central. News - SparkFun Electronics.
Dynamic Systems - Block Diagram Problems. Lean manufacturing. Overview[edit] The difference between these two approaches is not the goal itself, but rather the prime approach to achieving it.
The implementation of smooth flow exposes quality problems that already existed, and thus waste reduction naturally happens as a consequence. The advantage claimed for this approach is that it naturally takes a system-wide perspective, whereas a waste focus sometimes wrongly assumes this perspective. Both lean and TPS can be seen as a loosely connected set of potentially competing principles whose goal is cost reduction by the elimination of waste.[5] These principles include: Pull processing, Perfect first-time quality, Waste minimization, Continuous improvement, Flexibility, Building and maintaining a long term relationship with suppliers, Autonomation, Load leveling and Production flow and Visual control.
Origins[edit] Lean aims to make the work simple enough to understand, do and manage. A brief history of waste reduction thinking[edit] 20th century[edit] How to ace the world's toughest job interview question. Gases - Ratios of Specific Heat. Temperature Conversion. COMRuinaPratap. R_shanthini_Thermodynamics_Book. Pressure Conversion - Convert Pascal, Kpa, Mpa, Bar, Torr, Psi, Atm. College Physics. The Individual and Universal Gas Constant. The Individual and Universal Gas Constant in fluid mechanics and thermodynamics The Individual and the Universal Gas Constant are known from the Ideal Gas Law.
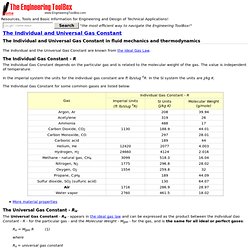
The Individual Gas Constant - R The Individual Gas Constant depends on the particular gas and is related to the molecular weight of the gas. The value is independent of temperature. In the imperial system the units for the individual gas constant are ft lb/slug oR. The Individual Gas Constant for some common gases are listed below: More material properties The Universal Gas Constant - Ru The Universal Gas Constant - Ru - appears in the ideal gas law and can be expressed as the product between the Individual Gas Constant - R - for the particular gas - and the Molecular Weight - Mgas - for the gas, and is the same for all ideal or perfect gases: