
Nudging. Double Entry Bookkeeping. What is the Debtor Days Ratio?
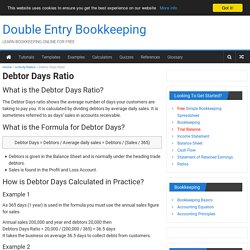
The Debtor Days ratio shows the average number of days your customers are taking to pay you. It is calculated by dividing debtors by average daily sales. It is sometimes referred to as days’ sales in accounts receivable. What is the Formula for Debtor Days? Debtor Days = Debtors / Average daily sales = Debtors / (Sales / 365) Debtors is given in the Balance Sheet and is normally under the heading trade debtors.Sales is found in the Profit and Loss Account. How is Debtor Days Calculated in Practice? Example 1 As 365 days (1 year) is used in the formula you must use the annual sales figure for sales. Annual sales 200,000 and year end debtors 20,000 then Debtors Days Ratio = 20,000 / (200,000 / 365) = 36.5 days It takes the business on average 36.5 days to collect debts from customers. Example 2 If you are using sales for a different period then replace the 365 with the number of days in the management accounting period. What does the Debtor Days Ratio Show? Accounts Receivables. Communication Skills - Improve Your Communication With MindTools.com.
©iStockphotosvengine Learn the secret to developing excellent communication skills.

Have you ever struggled to get your message across? Perhaps you tried pitching a groundbreaking project, you were chairing a departmental meeting, or you needed to deliver a compelling presentation. You gave it your best shot, but all you got back were blank looks and awkward silences. Chances are, there wasn't much wrong with what you were trying to say; it's just that you needed to work on how you said it. 1: Understanding the Basics It's important to take a systematic approach to communication, given the wide range of channels that are available, such as emails, marketing materials, presentations, and other written and spoken forms.
A good place to start is with our article, The Communication Cycle, which covers the basics of using any medium. How to Improve Accuracy in the Workplace. A framework for managing global teams effectively. Thanks for celebrating our 10th birthday with us. To cap it off: our most popular posts ever. 'Fun' data visualization predicts when you're going to die. Why #Maps are the Next Big #DataViz Trend @analyticsonfire #IoT #location #geospatial. 20 Cognitive Biases That Affect Your Decisions — Ask irritating coworkers to elaborate on their ideas over email. How do you reach sports fans - visualized #smsports #smm. Hello Everyone, In this article you can learn about how to pick the value from the left side through Vlookup,... The Ultimate Guide To Note-Taking [Infographic] Manegement Tools. A Periodic Table of Visualization Methods.
SmartKPIs.com - KPI examples, KPI definitions, KPI reporting, templates, advice and smart performance resources. Office Templates - CVs, Presentations & more. Quantitative Risk Management by AntiClue. Professional Tools. Periodic Table of Visualization Methods. 22 free tools for data visualization and analysis. You may not think you've got much in common with an investigative journalist or an academic medical researcher.
But if you're trying to extract useful information from an ever-increasing inflow of data, you'll likely find visualization useful -- whether it's to show patterns or trends with graphics instead of mountains of text, or to try to explain complex issues to a nontechnical audience. There are many tools around to help turn data into graphics, but they can carry hefty price tags. The cost can make sense for professionals whose primary job is to find meaning in mountains of information, but you might not be able to justify such an expense if you or your users only need a graphics application from time to time, or if your budget for new tools is somewhat limited.
If one of the higher-priced options is out of your reach, there are a surprising number of highly robust tools for data visualization and analysis that are available at no charge. KPI and performance measure tips, templates, techniques & tools. Diagrams. Glasgow City Council Homepage. What is the Balanced Scorecard? The balanced scorecard is a strategic planning and management system that is used extensively in business and industry, government, and nonprofit organizations worldwide to align business activities to the vision and strategy of the organization, improve internal and external communications, and monitor organization performance against strategic goals.
It was originated by Drs. Robert Kaplan (Harvard Business School) and David Norton as a performance measurement framework that added strategic non-financial performance measures to traditional financial metrics to give managers and executives a more 'balanced' view of organizational performance. The balanced scorecard has evolved from its early use as a simple performance measurement framework to a full strategic planning and management system. The “new” balanced scorecard transforms an organization’s strategic plan from an attractive but passive document into the "marching orders" for the organization on a daily basis.
Visualising Data. KPI Library - Discover the right Key Performance Indicators. Hello - visualisation. Hello I’m David McCandless, a London-based author, writer and designer.
I’ve written for The Guardian, Wired and others. I’m into anything strange and interesting. These days I’m an independent data journalist and information designer. A passion of mine is visualizing information – facts, data, ideas, subjects, issues, statistics, questions – all with the minimum of words. I’m interested in how designed information can help us understand the world, cut through BS and reveal the hidden connections, patterns and stories underneath. My pet-hate is pie charts. Our mission. A Periodic Table of Visualization Methods. Dashboard Design - Solutions - Business Analytics. Excel 2010. Scottish Government, devolved Government Scotland, devolution, Scottish Executive, Scottish Office.