
Infographics. Data journalism. Data journalism is a journalism specialty reflecting the increased role that numerical data is used in the production and distribution of information in the digital era.
It reflects the increased interaction between content producers (journalist) and several other fields such as design, computer science and statistics. From the point of view of journalists, it represents "an overlapping set of competencies drawn from disparate fields".[1] Data journalism has been widely used to unite several concepts and link them to journalism. Some see these as levels or stages leading from the simpler to the more complex uses of new technologies in the journalistic process.[2] Designers are not always part of the process, according to author and data journalism trainer Henk van Ess [3] "Datajournalism can be based on any data that has to be processed first with tools before a relevant story is possible.
Areas covered[edit] Emergence as a concept[edit] Notes[edit] Top Secret America. Admintrips - Die Reisedatenbank der Bundesverwaltung. Syria Deeply, Covering the Crisis. Data-driven investigations - Detective.io. The Migrants' Files project was launched in August 2013 by a group of European journalists who joined forces to accurately calculate and report the deaths of emigrants seeking refuge in Europe.
This pan-European consortium of journalists is partially funded by the European non-profit organization Journalismfund.eu. Subscribe to the Migrants Files newsletter for quarterly updates. They know their lives are at risk, yet each year thousands of people from Africa, the Middle East and beyond — war refugees, asylum seekers and economic migrants — leave their homes and try to reach the promised land of Europe. On the third of October 2013, more than 360 would-be emigrants drowned off the coast of the Italian island of Lampedusa.
A catastrophe of this dimension grabbed the media’s attention for a while and won the sympathy of the general public. Well-intended though they doubtless were, these measures only address the tip of the migration iceberg. Collecter pour mieux analyser : les bases de données et le journalisme. Les défis de l’Arabie saoudite. Data Gueule. Bienvenue. Visualization and Statistics. 3 leçons sur le journalisme 2.0. Le Monde.fr | • Mis à jour le | Par Luc Vinogradoff (Austin, envoyé spécial) Comme tous les ans, le journalisme, et son futur, a été un des thèmes récurrents lors du festival « South By Southwest » (SXSW), consacré aux nouvelles technologies, à Austin (Texas).
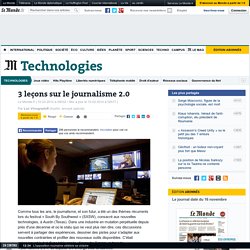
Dans une industrie en mutation perpétuelle depuis près d'une décennie et où le statu quo ne veut plus rien dire, ces discussions servent à partager des expériences, dessiner des pistes pour s'adapter aux nouvelles contraintes et profiter des nouveaux outils disponibles. C'était précisément le but d'une table ronde, dimanche 9 mars, autour du « journalisme 2.0 », de laquelle ont émergé trois tendances.
Pour couvrir un sujet à fond, faire un site dédié Aux Etats-Unis, comme en France, certains sujets d'actualité cruciaux ne semblent pas intéresser, a priori, la majorité des lecteurs. Lara Setrakian, qui était correspondante de la chaîne CBS au Proche-Orient, a décidé de lancer le site Syria Deeply, exclusivement dédié à ce pays. Casual visualization books for the coffee table. Since my son was born, it's been a challenge to focus on a single book for any prolonged amount of time.
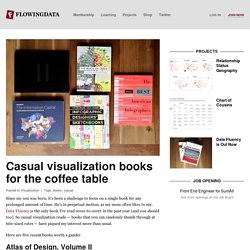
He's in perpetual motion, as my mom often likes to say. Data Fluency is the only book I've read cover-to-cover in the past year (and you should too). So casual visualization reads — books that you can randomly thumb through at bite-sized rates — have piqued my interest more than usual. Here are five recent books worth a gander. Atlas of Design, Volume II I enjoyed the first volume of the Atlas of Design, so I was happy to see a second volume come out. Each map is accompanied by a description from the cartographers themselves, which provides context to what the map is and how it came about. London: The Information Capital The Information Capital by geographer James Cheshire and designer Oliver Uberti is all about London.