
Heat Mapping Crime Data with Bing Maps and HTML5 Canvas. Crime data is frequently presented using “heat maps”.
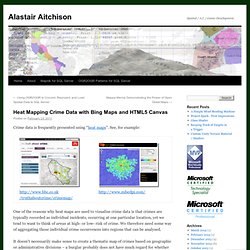
See, for example: One of the reasons why heat maps are used to visualise crime data is that crimes are typically recorded as individual incidents, occurring at one particular location, yet we tend to want to think of areas at high- or low- risk of crime. We therefore need some way of aggregating those individual crime occurrences into regions that can be analysed. It doesn’t necessarily make sense to create a thematic map of crimes based on geographic or administrative divisions – a burglar probably does not have much regard for whether he commits a crime in one polling district/ward/street of a city or another, for example, and we should not attempt to fit the distribution of crimes to such arbitrary regions. To start with, I created an array of locations from which my heatmap would be created. Node.js + Express + Leaflet + PostGIS = Awesome Maps. Recently I blogged about using GeoJSON to create a very lean application for serving dynamic maps.
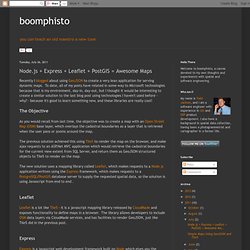
To date, all of my posts have related in some way to Microsoft technologies because that is my environment, day-in, day-out, but I thought it would be interesting to create a similar solution to the last blog post using technologies I haven't used before - why? - because it's good to learn something new, and these libraries are really cool!
DeCarta devZone. Leaflet - a modern, lightweight JavaScript library for interactive maps by CloudMade. Node.js. HTML5 Mobile Mapping.