
Welcome to the Matplotlib Basemap Toolkit documentation! — Basemap Matplotlib Toolkit 1.0.5 documentation. Plotting data on a map (Example Gallery) — Basemap Matplotlib Toolkit 1.0.5 documentation. Following are a series of examples that illustrate how to use Basemap instance methods to plot your data on a map.
More examples are included in the examples directory of the basemap source distribution. There are a number of Basemap instance methods for plotting data: contour(): draw contour lines.contourf(): draw filled contours.imshow(): draw an image.pcolor(): draw a pseudocolor plot.pcolormesh(): draw a pseudocolor plot (faster version for regular meshes).plot(): draw lines and/or markers.scatter(): draw points with markers.quiver(): draw vectors.barbs(): draw wind barbs.drawgreatcircle(): draw a great circle.
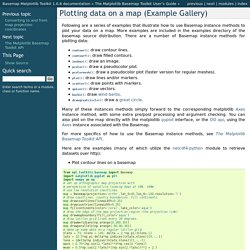
Many of these instances methods simply forward to the corresponding matplotlib Axes instance method, with some extra pre/post processing and argument checking. You can also plot on the map directly with the matplotlib pyplot interface, or the OO api, using the Axes instance associated with the Basemap. Plot contour lines on a basemap (Source code) Plot precip with filled contours. Python.matplotlib.devel - Re: Some queries regarding basemap. - msg#00049. Note to self: quickly plot a shapefile using Python and basemap : Carlo Hamalainen. Matplotlib Basemap tutorial 07: Shapefiles unleached.
Plotting Geographical Data using Basemap. Exclusive offer: get 50% off this eBook here Matplotlib for Python Developers — Save 50% Build remarkable publication-quality plots the easy way by Sandro Tosi | October 2009 | Open Source This article by Sandro Tosi is dedicated to Basemap, a Matplotlib toolkit to draw geographical data.
We can use Matplotlib to draw on geographical map projections using the Basemap external toolkit. Basemap is a Matplotlib toolkit, a collection of application-specific functions that extends Matplotlib functionalities, and its complete documentation is available at Toolkits are not present in the default Matplotlib installation (in fact, they also have a different namespace, mpl_toolkits), so we have to install Basemap separately.
Basemap is useful for scientists such as oceanographers and meteorologists, but other users may also find it interesting. We use the 0.99.3 version of Basemap for our examples. First example Let's start playing with the library. This conversion cannot be done without distortion. Python.matplotlib.general - Re: BaseMap question - msg#00029. Travis Brady wrote: I'd like to make a map of the U.S. where I draw the state lines and apply a color to each state based on a ratio I've got in my data.
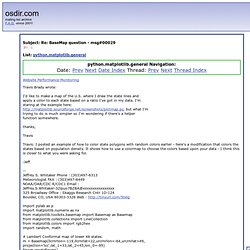
I'm staring at the example here: but what I'm trying to do is much simpler so I'm wondering if there's a helper function somewhere. thanks, Travis Travis: I posted an example of how to color state polygons with random colors earlier - here's a modification that colors the states based on population density. -Jeff -- Jeffrey S. Import pylab as p import matplotlib.numerix as nx from matplotlib.toolkits.basemap import Basemap as Basemap from matplotlib.collections import LineCollection from matplotlib.colors import rgb2hex import random, math.
User_interfaces example code: svg_histogram.py.